October 2024 Market Insights

Welcome to the October edition of the Market Insights column brought to you by the Kenanga Digital Investing (KDI) team. In this edition, Our Head of Digital Investing, Cheong Yew Huan, will discuss the latest financial news and share his insights on how to make the most of today’s market.
Market Recap
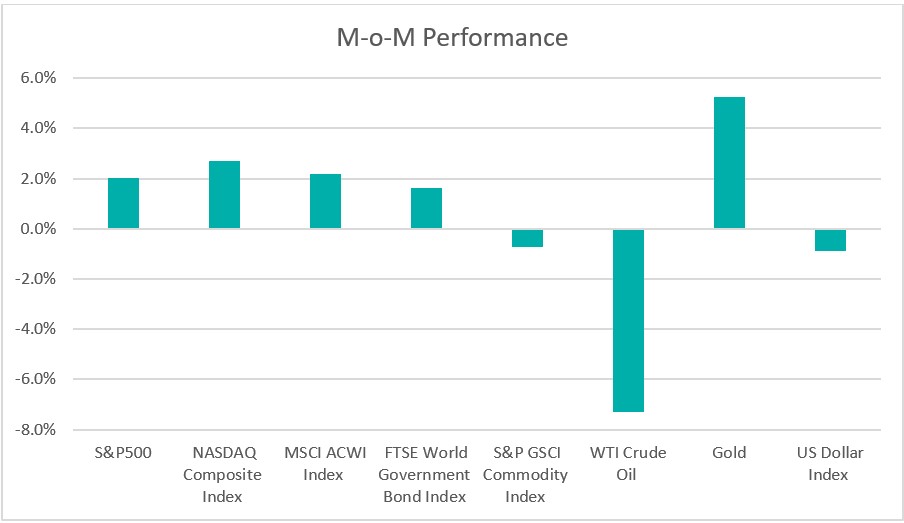
Chart 1: Index Performance in September 2024

Market
Global equity markets reached new all-time highs in September, supported by central banks initiating their rate-cutting cycles and China unveiling a broad package of monetary stimulus measures to bolster its economy. The MSCI ACWI Index rose by 2.2%, while U.S. stocks continued their upward trajectory, with the S&P 500 climbing 2% and the Nasdaq Composite advancing 2.7% for the month.
In fixed income, U.S. Treasury yields had already declined in anticipation of the Federal Reserve’s rate cuts. Yields on the two-year Treasury, which is sensitive to interest rate expectations, dropped to 3.6411%, while the 10-year Treasury yield settled around 3.7809%, leading to a continued steepening of the yield curve. According to the latest Fed Watch tool, bond investors now see an 89.5% chance of another 25-basis-point cut at the Fed’s November meeting.
In September, commodities had mixed performances. The S&P GSCI Commodity Index fell by 0.7% over the month. Oil prices were notably volatile, with WTI crude dropping to US$65 per barrel before rebounding to close at US$68 per barrel. This volatility was driven by concerns over a potential escalation of conflict in the Middle East involving Iran, as well as worries about reduced demand due to China’s slowing economy. Meanwhile, gold surged past US$2,600 per ounce, fueled by growing demand for safe-haven assets amid geopolitical tensions and Federal Reserve rate cuts. Analysts expect further gains as the Fed is anticipated to continue easing monetary policy.
The U.S. dollar weakened against major currencies in September, declining by 0.9%. Expectations of further rate cuts by the Federal Reserve could reduce the dollar’s yield advantage, potentially leading to further depreciation.
Outlook
Uncertainty surrounding the upcoming U.S. presidential election on November 5 is dampening business sentiment. Business activity slowed slightly in early September, with the S&P Flash U.S. Composite PMI Output Index falling to 54.4. The labour market also showed signs of cooling, as job openings dropped to a 3.5-year low in July. Retail sales rose by 0.1% in August, following an upwardly revised 1.1% surge in July, according to the Commerce Department’s Census Bureau. With signs of a cooling economy and shifting spending trends, the Federal Reserve initiated its easing cycle with a surprise 0.5% interest rate cut, signalling additional reductions in the coming quarters, aiming for a neutral interest rate by 2026. Fed Chair Jerome Powell indicated a preference for smaller, quarter-percentage-point cuts in the future. Overall, the economic outlook presents mixed signals, with moderate inflation trends influencing the Federal Reserve’s monetary policy decisions moving forward.
China’s economic data for August highlighted significant concerns, including a slowdown in industrial output and weak retail sales. The property sector remains a major challenge, with new home prices falling at their fastest rate in over nine years. In response, the Chinese government introduced a substantial stimulus package to boost the slowing economy and restore investor confidence. Major cities across mainland China implemented easing measures to improve homebuyer sentiment. Additionally, the central bank launched a comprehensive set of monetary stimulus initiatives, including a reduction in existing individual mortgage interest rates by an average of 0.5 percentage points and a 50-basis-point cut in the reserve requirement ratio (RRR) for banks. To further support the market, a 500 billion yuan swap program was introduced to finance stock purchases by brokers, funds, and insurers. As a result of these extensive measures, the stock market saw a significant turnaround, with major indices posting notable gains in September.
Table 1: KDI Invest Portfolio Performance as at 30 September 2024

The provided table offers information on the cumulative performance of selected KDI portfolios since their launch on February 15, 2022. The portfolio returns (in USD) range from 0.4%% to 8.1%. Year-to date, all portfolios recorded positive returns within a range of 6.9% to 17.8%.
The S&P 500 Index has rebounded to a record high after a dip in July. Looking ahead, several factors, including growing concerns about the U.S. economic outlook, shifts in Federal Reserve (Fed) policy, stretched market valuations, and the upcoming U.S. election, could contribute to increased market volatility. Weakening labour market data and declining economic indicators have fuelled speculation that further interest rate cuts may be on the horizon. As central banks, including the Fed, initiate monetary easing, bonds and gold are becoming increasingly attractive as safe havens against a potential recession or rising inflation.
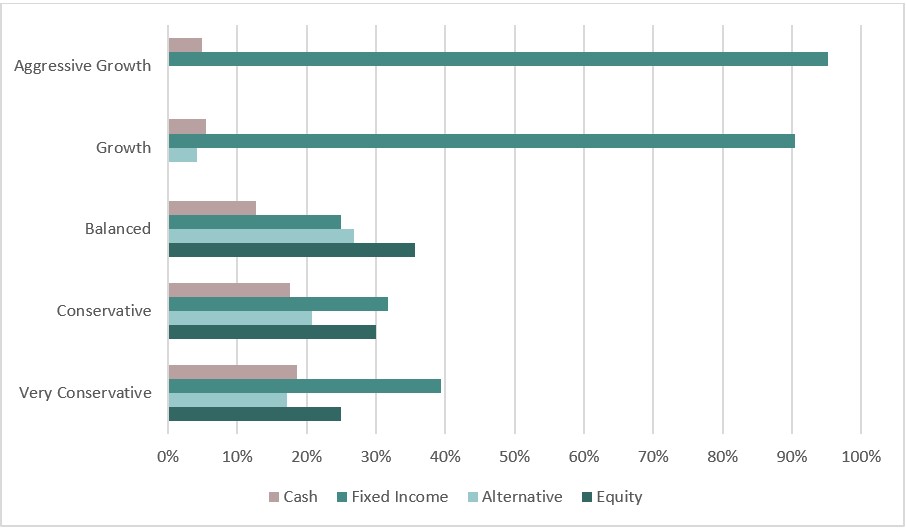
With signs of shifts in both the economic and interest rate cycles, more investment opportunities are emerging in fixed income and gold. KDI AI has dynamically adjusted its portfolios, allocating a significant portion of assets to fixed income, with allocations ranging from 39% to 95%. Equity investments comprise up to 36% of the portfolio, while alternative investments, primarily in the gold ETF (GLD), account for up to 27%. Additionally, cash holdings within the portfolios range from 5% to 19%.
Chart 2: Asset Class Exposure as at 30 September 2024

Please note that the performance and asset class exposure mentioned above are derived from five proxy portfolios. The actual performance and exposure of KDI Invest portfolio may differ due to the customisation by our A.I. based robo-advisor, which tailors investment to individual risk profiles, as well as the timing of market entry.
Citation:
https://www.cmegroup.com/markets/interest-rates/cme-fedwatch-tool.html


