October 2022 Market Insights

Brought to you by the Kenanga Digital Investing (KDI) team, here is our 9th Market Insights column. Our Head of Digital Investing, Cheong Yew Huan will discuss the latest in financial news and present his thoughts on making the most of today’s market.
Market Recap
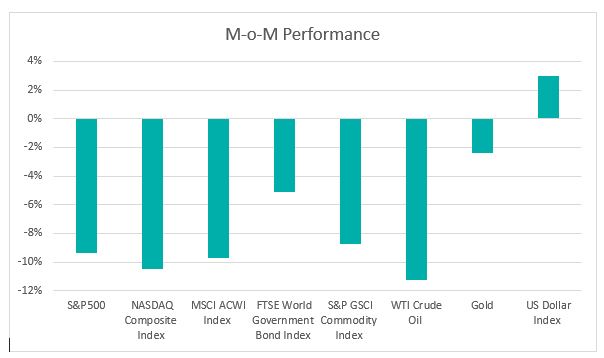
Chart 1: Index Performance in September 2022

Market
The sell-off equities intensified in September. The S&P500 has posted losses for three consecutive quarters and reached the lowest level since November 2020. In September, S&P500 fell 9.3% while the Nasdaq Composite Index lost 10.5%. Year-to-date, the S&P500 and Nasdaq Composite Indexes were down 24.8% and 32.4% respectively. The dip in the market is largely attributable to concerns about recession risk and the continuous interest rate hikes by central banks to curb inflation.
Bond markets reacted to the growing recession risk with the Treasury yield curve further inverted. While the yield on the 2-year Treasury note hit above 4% for the first time since 2007, the 2-year treasury yield over the 10-year Treasury yield inverted to beyond 50-basis points during the month, reflecting the concerns about the economic recession.
Crude Oil WTI Futures dropped below US$80 during the month and posted their first quarterly decline in more than two years on concerns that a global economic slowdown will hurt energy consumption. Gold prices slid to the lowest in more than two years as tighter Fed policy and Europe’s worsening energy crisis have pushed up the US currency.
The US Dollar Index, which measures the US Dollar against a basket of currencies, jumped to 112.12, its highest level since 2002. Year-to-date, the US Dollar currency appreciation by 16.8%, has triggered concern of central banks around the world on the potential exchange rate and other financial shocks.
Outlook
Inflation may take some time to come down. Core inflation generally remains well above central bank targets in most countries, which is why markets are pricing significant further policy rate increases in the coming months. The Fed raised benchmark interest rates by another 75 basis points to a range of 3.00%-3.25%, the highest since early 2008. The U.S. Federal Reserve signalled that the economic slowdown could happen due to a series of rate hikes. The market expects the Fed increases another 75 basis points in November, followed by a 50 basis points hike in December.
Global economic growth is slowing more than earlier forecast in the wake of Russia’s invasion of Ukraine, as energy and inflation crises risk snowballing into recession in major economies, according to OECD Interim Economic Outlook released in September. Some of the leading indicators for the US economy, such as the Institute for Supply Management’s Index (ISM) for new orders, have softened. The ISM survey’s forward-looking new orders sub-index fell to 47.1 last month, also the lowest reading since May 2020, from 51.3 in August. It was the third time this year that the index has contracted.
OECD has lowered its global growth forecast in 2023 to 2.2% from an earlier projection of 2.8%. Inflation has become broad-based in many economies. Tighter monetary policy and easing supply bottlenecks should moderate inflation pressures next year, but elevated energy prices and higher labour costs are likely to slow the decline. Despite the deteriorating outlook in major economies, the OECD forecasts most major central banks’ policy rates would top 4% next year in curbing inflation.
The recent FedEx warning on global recession and hiring freeze by Meta and Amazon indicates the corporate earnings outlook remains challenging. The upcoming quarterly earnings reports will be crucial as investors will look for visibility on the company’s earnings outlook for the rest of the year and the year ahead.
According to the latest Bank of America’s September Global Fund Survey, fund managers worldwide have increased their cash holdings amid rising inflation, central bank tightening, and geopolitical tensions. Fund managers are “super bearish” with cash allocation at 6.1%, the highest since October 2001 and above long- term average of 4.8%.
KDI Invest Portfolio Performance As at 30 September 2022

Remarks:
Benchmark: Equity: MSCI ACWI Index + Fixed Income: FTSE World Government Bond Index
Past performance is not indicative of future results.
The above table shows the performance of selected KDI portfolios since their launch on 15 February. The portfolio returns are ranging from -17.6% to -7.9%, outperforming the benchmark by 3.0% to 13.6%.
With the market outlook being subject to various downside risks, a new portfolio rebalancing was triggered in the first two weeks of September 2022 with the adoption of defensive moves in reducing the portfolio volatility.
The major changes are as follows:
- The uncertainty in the equity asset class remains high due to the increasing risks of global recession and the robo-advisor A.I. took steps to protect the portfolio from extreme volatility by reducing the equity weighting.
- Adopted “risk-off” asset allocation by increasing the fixed income exposure. The main holdings include iShares Short Treasury Bond ETF (SHV), which has exposure in short-dated US Treasuries, SPDR Bloomberg Barclays International Treasury Bond ETF (BWX), global ex-US investment grade government securities, and iShares 7-10 Year Treasury Bond ETF (IEF), which invests in US government bonds with maturity between 7 and 10 years.
- Increased cash or cash equivalent holdings exposure. In this uncertain environment, KDI robo-advisor A.I. tends to favour portfolio flexibility and liquidity to respond to events and potentially take advantage of nascent opportunities.


