
Cracks in the Consensus

Executive Summary
The Federal Reserve’s decision to hold interest rates steady in late July meeting appears to carry the message of continuity. However, underneath, it was anything but. The policy committee voted 9-3 to keep rates at 3.50% to 3.75%, with dissenting votes raising pressure for a September rate hike. Markets read the hold as hawkish, with the data putting the odds of a September rate hike at roughly 67%. That conviction wavered when nonfarm payrolls added just 57,000 jobs in July, well short of the roughly 115,000 economists had expected, and were later revised down further to +20,000.
Equity markets absorbed the crosscurrents through rotation rather than retreating. The S&P finished July essentially flat, down 0.1%, while the Nasdaq fell 3.2% as investors pulled back from technology names. Energy (+12.6%) and financials (+5.6%) led gains, benefitting from a mid-month oil rally and rising Treasury yields, while industrials, utilities and technology all declined. Overseas the picture was similarly uneven, with China’s GDP growth slowing to 4.3% year-on-year in the second quarter, while July manufacturing activity unexpectedly slipped into contraction for the first time in five months. Retail sales growth also cooled, rising just 0.6% year-on-year against forecasts of a 1.5% gain.
July’s portfolio performance mirrored the rotation running through markets more broadly. More conservative, fixed-income-heavy portfolios felt the rise in treasury yields most directly, while portfolios with larger equity allocations benefited from broader market resilience. This is diversification doing exactly what it is designed to do, where no single allocation captures every month’s leadership. Since inception, our portfolios have delivered cumulative returns ranging from -3.2% to 15.5%, a span built by staying invested through months that looked very different from one another.
Against this backdrop of a hawkish Fed narrative meeting softening data, our portfolios posted mixed but resilient July returns. We remain committed to create long-term value to our clients and encourage our clients to remain diversified in portfolios built to weather a divided market.
Fund Performance Highlights
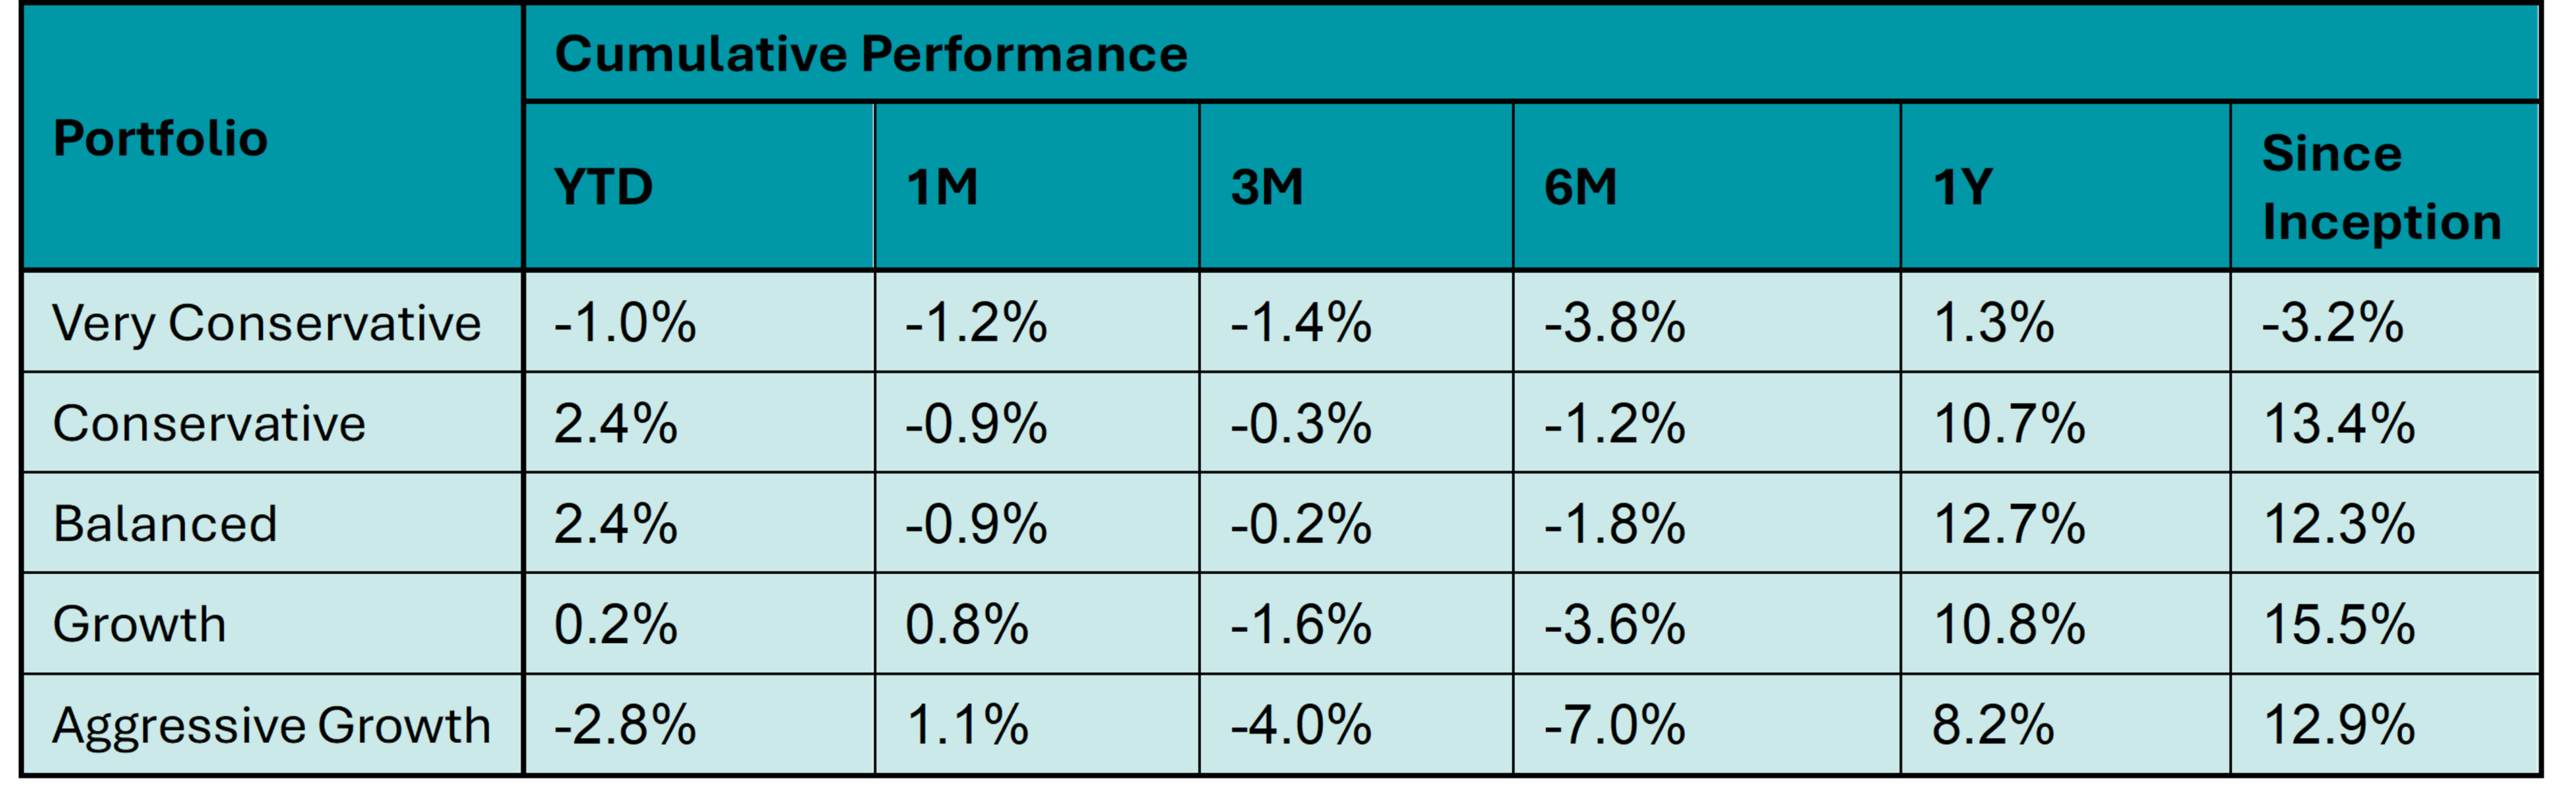
Table 1: KDI Invest Portfolio Performance (as of 31 July 2026).
The provided table offers information on the cumulative performance of selected KDI portfolios since their launch on February 15, 2022. The portfolio returns (in USD) range from -3.2% to 15.5%. In 2026, the portfolios recorded returns within a range of -2.8% to 2.4%.
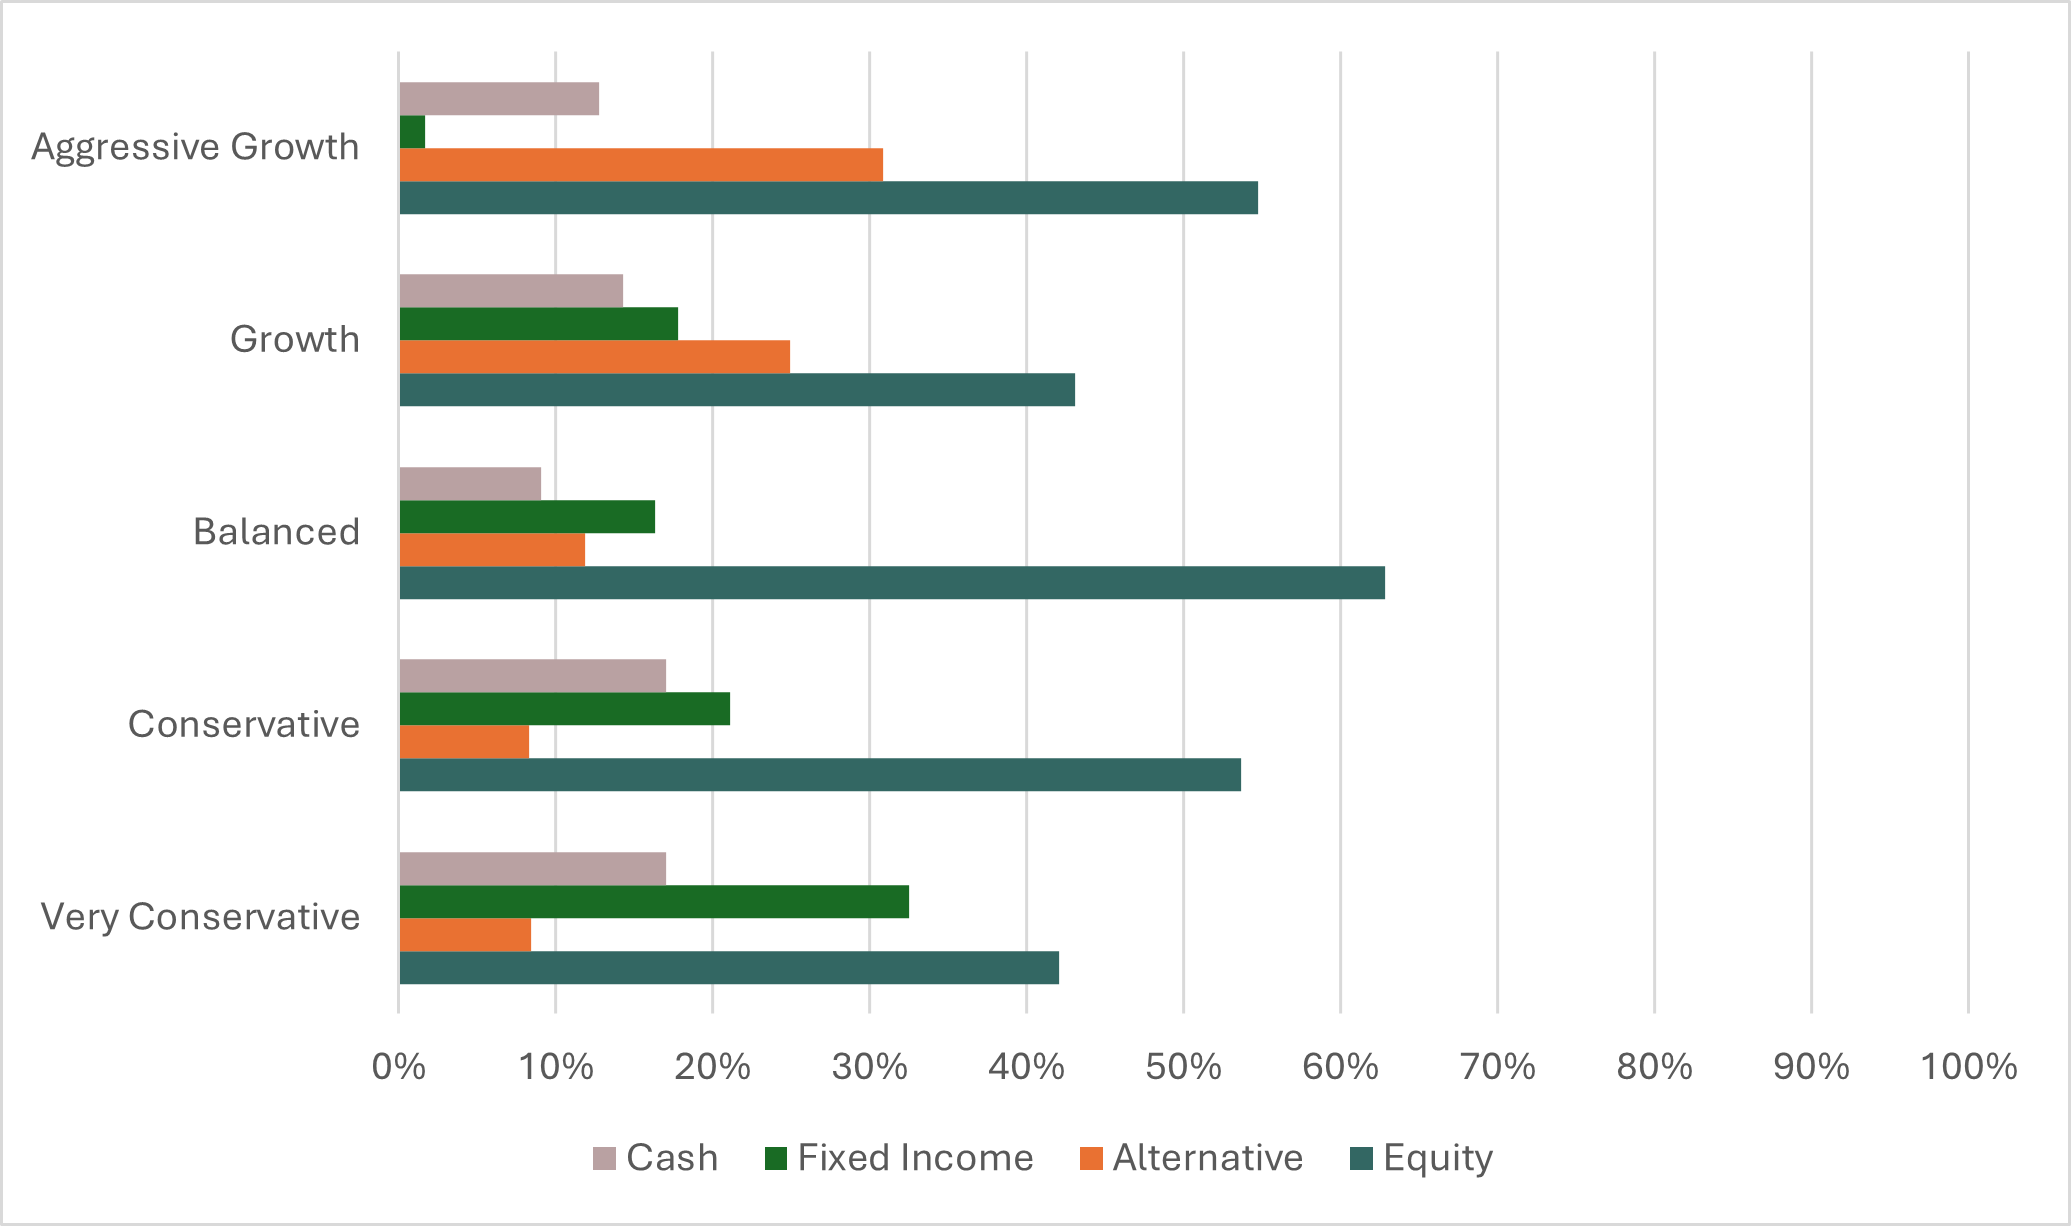
Chart 2: Asset Class Exposure (as at 31 July 2026).
In July, our model maintained our equity-focused positioning as market momentum remained supportive. The portfolio remains well positioned to participate in continued gains in risk assets while retaining diversification across fixed income, commodities, and cash.
Kindly note that the performance and asset class exposure illustrated above are derived from five proxy portfolios. The actual performance and exposure of your investment portfolio may differ due to the customisation made by our proprietary algorithms that tailors the investment to your unique risk profile, as well as the timing of market entry.
Market Recap
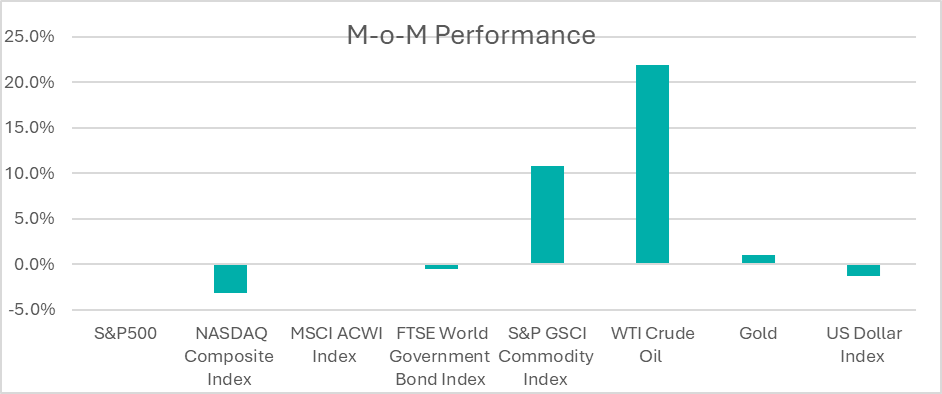
Chart 1: Index Performance in July 2026.
In July 2026, the S&P 500 slipped 0.1% while the tech-heavy Nasdaq declined 3.2% as investors rotated out of technology stocks and into sectors such as energy and financials. The rotation was primarily driven by valuation and interest rate concerns as markets increasingly priced in the possibility of one or more rate hikes rather than rate cuts.
Both the 2-year and 10-year US Treasury moved higher by 12 and 27 basis points respectively in July as markets started pricing a greater risk that rates would stay elevated for longer due to sticky inflation and a more subdued jobs market. As at end-July 2026, CME FedWatch data indicated a 67% chance of 25bps rate hike at the Fed’s upcoming 16 Sept 2026 meeting.
Oil prices recovered strongly in July following June’s decline as the peace deal/ceasefire narrative that had previously pushed oil lower came under stress in July. Gold did not participate in the geopolitical rally as concerns over higher oil-driven inflation offset gold’s safe-haven appeal. Interestingly Bitcoin rose 8% to $64,297, which we believe was partly driven by a recovery from the weakness experienced earlier in the year.
The US dollar strengthened slightly against the Malaysian Ringgit, ending July-2026 at 4.086, from 4.084 in end-June 2026. To-date, up to Jul-2026, the Malaysian ringgit depreciated by 0.6% against the U.S. dollar.
Outlook
Inflation data released during July indicated continued moderation in price pressures – the headline CPI fell from 4.2% year-on-year (YoY) in May to 3.5% YoY in June, although inflation remains above the Federal Reserve’s target. The labour market showed signs of cooling. Nonfarm payrolls added 57,000 jobs in July, which significantly missed expectations of ~115,000; this was later revised down further to +20,000 in the August release.
At its July 2026 meeting, the Fed kept the policy rate unchanged at 3.50%–3.75% but maintained a hawkish bias. Despite a meaningful moderation in inflation data, the Fed continued to emphasize persistent inflation risk and refrained from signalling policy easing. As a result, market expectations shifted from rate cuts toward the possibility of further rate hikes.
China’s July economic data disappointed on most measures. China’s Q2 GDP growth came in at 4.3% YoY. Market consensus expected Q2 GDP to expand by around 5%, following a strong 5% growth in Q1. Retail sales increased only by 0.6% YoY. The official Manufacturing PMI fell to 49.2 from 50.3 in June, moving back into contraction territory. Strong export growth and high-tech manufacturing remained the economy’s bright spots, offsetting the slowdown in domestic demand. Overall, the weak numbers have increased expectations for stronger government fiscal stimulus and monetary easing in the second half of the year.
July brought profit-taking in tech names alongside gains in energy and financial sectors. Top gainers in July were energy (+12.6%), financials (+5.6%) and real estate (+2.4%). Conversely, the industrials, utilities and information technology sector dropped by 2% – 3% for the month.
Trade policy remained in focus as the US finalized and implemented its Section 301 tariff regime on imports from 60 economies. While the investigations and proposed tariffs had been known for months, investors gained clarity on the final tariff rates, country coverage, exemptions and implementation timeline. Bilateral tensions also escalated sharply, marked by 25% tariffs on targeted imports from Brazil and threats of 50% tariffs on Canadian motor vehicles and dairy.
Looking ahead, optimism isn’t unreasonable as we head into September. Inflation has moderated meaningfully since the spring, corporate earnings have largely held up despite the tech pullback, and a Fed that’s willing to raise rates in response to fresh data is, in its own way, a Fed still doing its job. We believe that this is a healthier setup than a central bank flying blind. Still, September won’t be uneventful; the Fed’s rate decision, a possible policy response from Beijing to Q2’s slowdown and the next phase of tariff implementation all land within weeks of each other. The more likely outcome isn’t smooth sailing or a hard landing, but rather a market that keeps adjusting its footing in real time, just the way it did in July.
Citation:
https://www.cmegroup.com/markets/interest-rates/cme-fedwatch-tool.html
Disclaimer
Kenanga Digital Investing (“KDI”) is licensed by the Securities Commission of Malaysia as a Digital Investment Management Company. KDI is authorised to carry out the business of fund management blending innovative technology into automated portfolio management services offered to clients under a license issued pursuant to Schedule 2 of the Capital Markets Services Act (CMSA) 2007.
Investment involves risk, including the possible loss of capital you invest. Past performance does not indicate future performance. Historical returns, expected returns, and probability projections are provided for informational and illustrative purposes, and may not reflect actual future performance. KDI does not assume any fiduciary responsibility or any liability for any consequences, financial or otherwise, arising from any transaction in reliance on such information. Investors should rely on their own evaluation or consult an independent financial, accounting, tax, legal or other professional advisers to access the merits and risks before investing.
Any forward-looking statements, predictions, projections or forecast on the economy, stock market, bond market or economic trends of the markets contained in this material are subject to the market influences and contingent upon matters outside the control of KDI and therefore may not be realised in the future. No representation is made as to the completeness and adequacy of the information to make an informed decision.
Neither the information, nor any opinion, contained in this article constitutes a promotion, recommendation, solicitation, invitation by KDI or its affiliates to buy or sell any securities, investment schemes or other financial instruments or services, nor shall any security, collective investment scheme, or other financial instruments or services be offered or sold to any person in any jurisdiction in which such offer, solicitation, purchase, or sale would be unlawful under the securities laws of such jurisdiction. This is not intended to be an invitation or offer made to the public to subscribe for any financial product or other transaction.
This information has not been reviewed by the Securities Commission of Malaysia.