
Profit-taking is in the Air, Not Panic

Executive Summary
After two of the strongest months markets have seen in years, the month of June was, by comparison, unremarkable; and it’s worth saying plainly rather than dressing up. The S&P 500 slipped 1.1% and the Nasdaq fell 2.8% as investors continued to take profits in the AI and chip stocks that drove most of the spring’s gains, rotating into industrials, consumer staples, and utilities; which were up 2.4%, 1.2% and 1.8% respectively for the month, while energy (-4.2%) and technology (-3.5%) led the declines. Separately the formal signing of a U.S.-Iran peace agreement on the 19th of June in Geneva had eased months of geopolitical risk pricing. Oil settled near US$70 a barrel, down roughly 20% for the month, while gold fell 12% and bitcoin declined to around US$59,500. All three retreated together as the risk premium built up over the conflict unwound.
The Federal Reserve held its policy rate at 3.50% to 3.75% for a fourth consecutive meeting, a unanimous decision under new Chair Kevin Warsh, but one delivered with a more cautious tone then markets had hoped for. Inflation remained elevated, with the latest reading at 4.2% year-on-year (y-o-y), and the policy conversation has evolved from “when will the Fed cut?” to “could the next move be a hike?”, reflecting a more hawkish outlook and reduced urgency to ease policy.
Across our portfolios, performance for the month reflected this shift. More conservative allocations held their ground, remaining positive for year, while growth-oriented portfolios felt the tech pullback more directly. Since inception, our portfolios have a delivered cumulative return ranging from -2.0% to 14.5%; a reminder of why we build diversification across, not just within asset classes. The same allocations that lag in a momentum-driven rally are the ones that hold steadier when that momentum pauses. As markets continue to simmer down from the rally, we continue to encourage our clients to maintain a diversified holding for the long-term.
Fund Performance Highlights
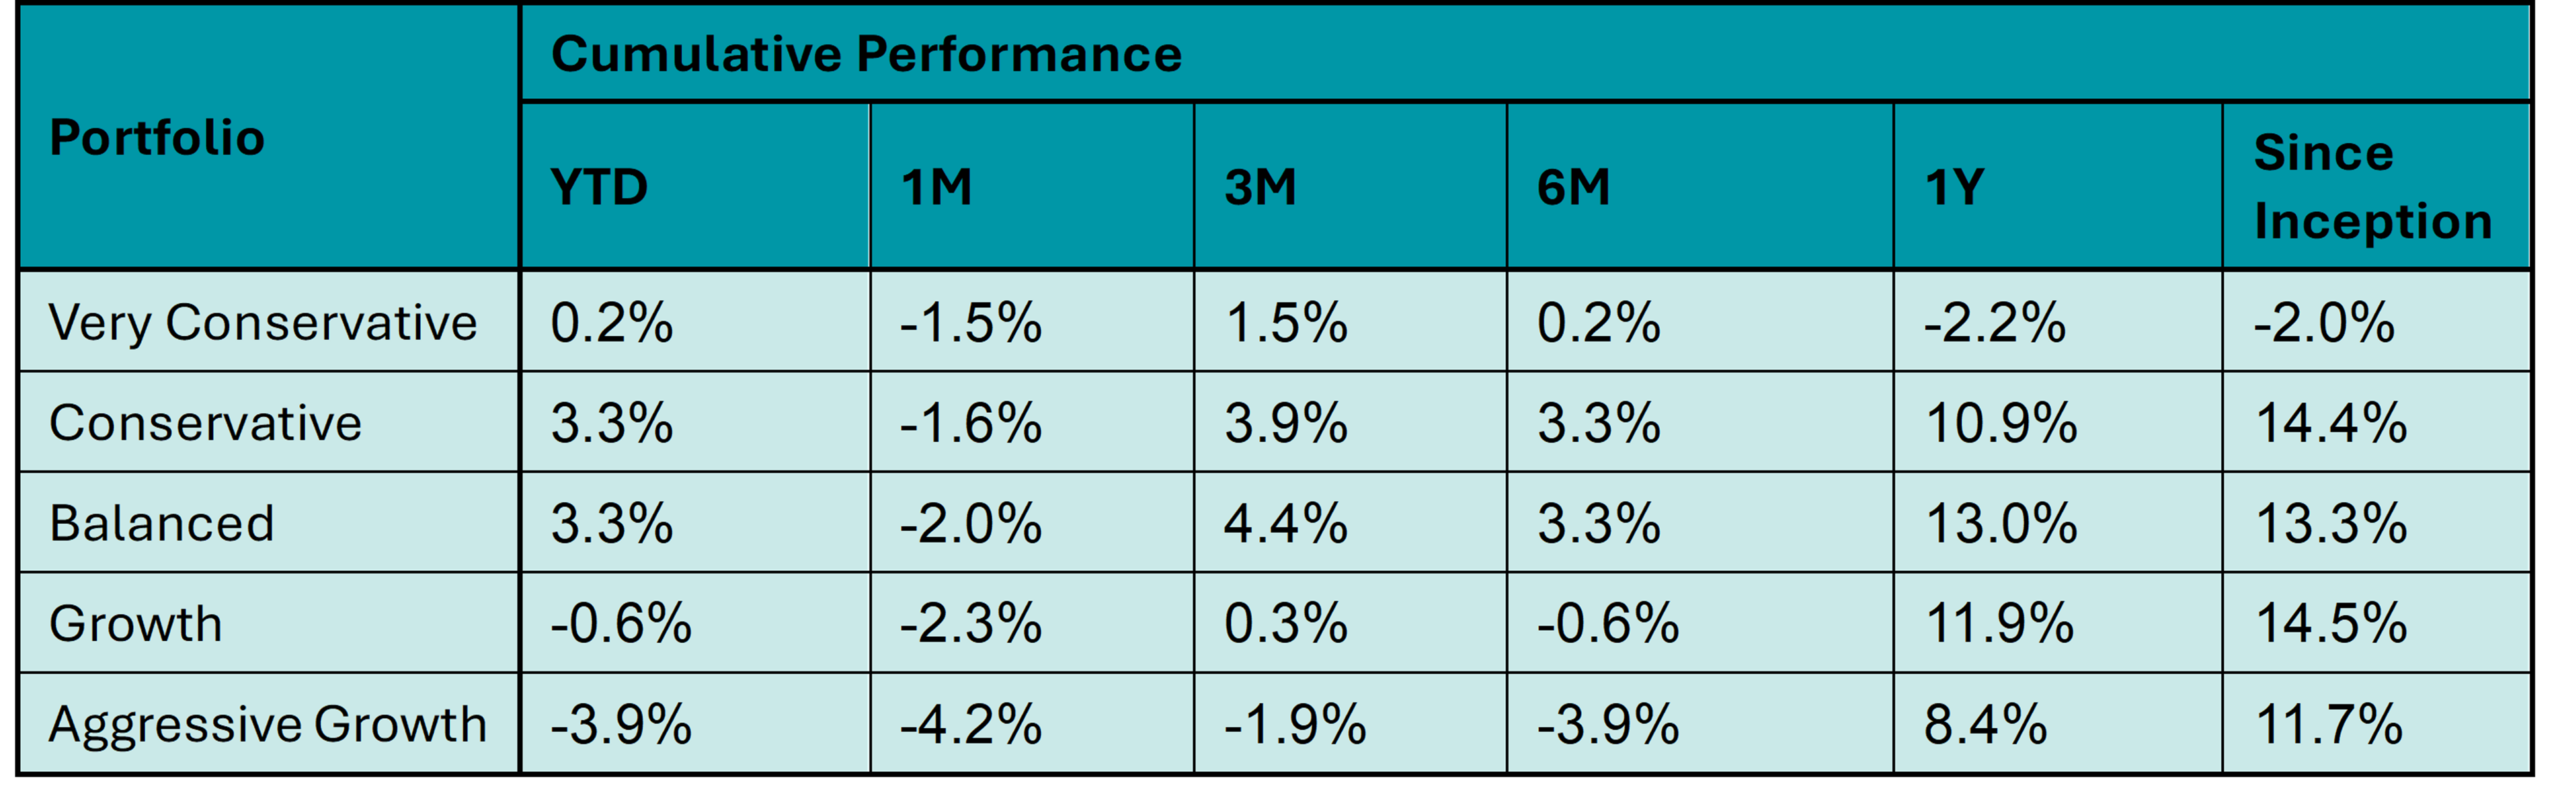
Table 1: KDI Invest Portfolio Performance (as of 30 June 2026).
The provided table offers information on the cumulative performance of selected KDI portfolios since their launch on February 15, 2022. The portfolio returns (in USD) range from -2.0% to 14.5%. In 2026, the portfolios recorded returns within a range of -3.9% to 3.3%.
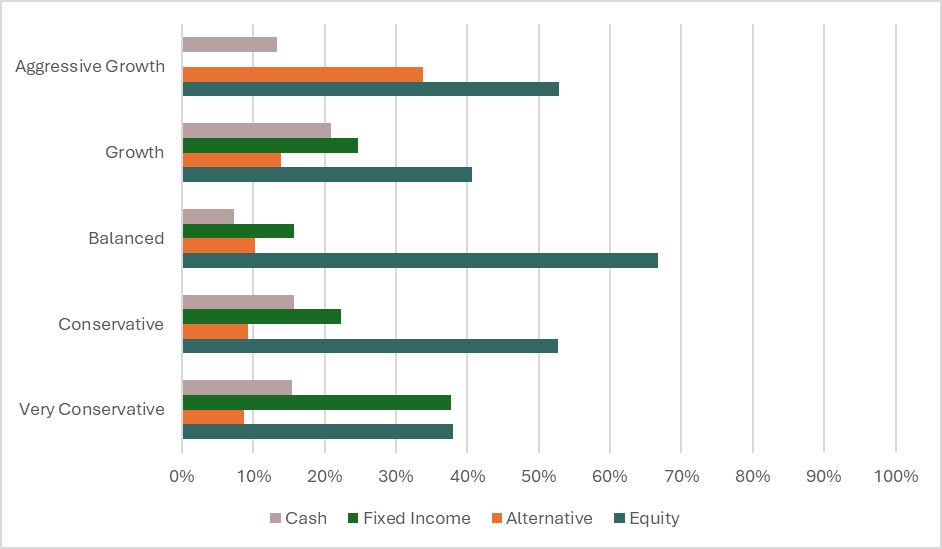
Chart 2: Asset Class Exposure (as at 30 June 2026).
In June, we maintained our equity-focused positioning as market momentum remained supportive. The portfolio remained well positioned to participate in continued gains in risk assets while retaining diversification across fixed income, commodities, and cash.
Kindly note that the performance and asset class exposure illustrated above are derived from five proxy portfolios. The actual performance and exposure of your investment portfolio may differ due to the customisation made by our proprietary algorithms that tailors the investment to your unique risk profile, as well as the timing of market entry.
Market Recap
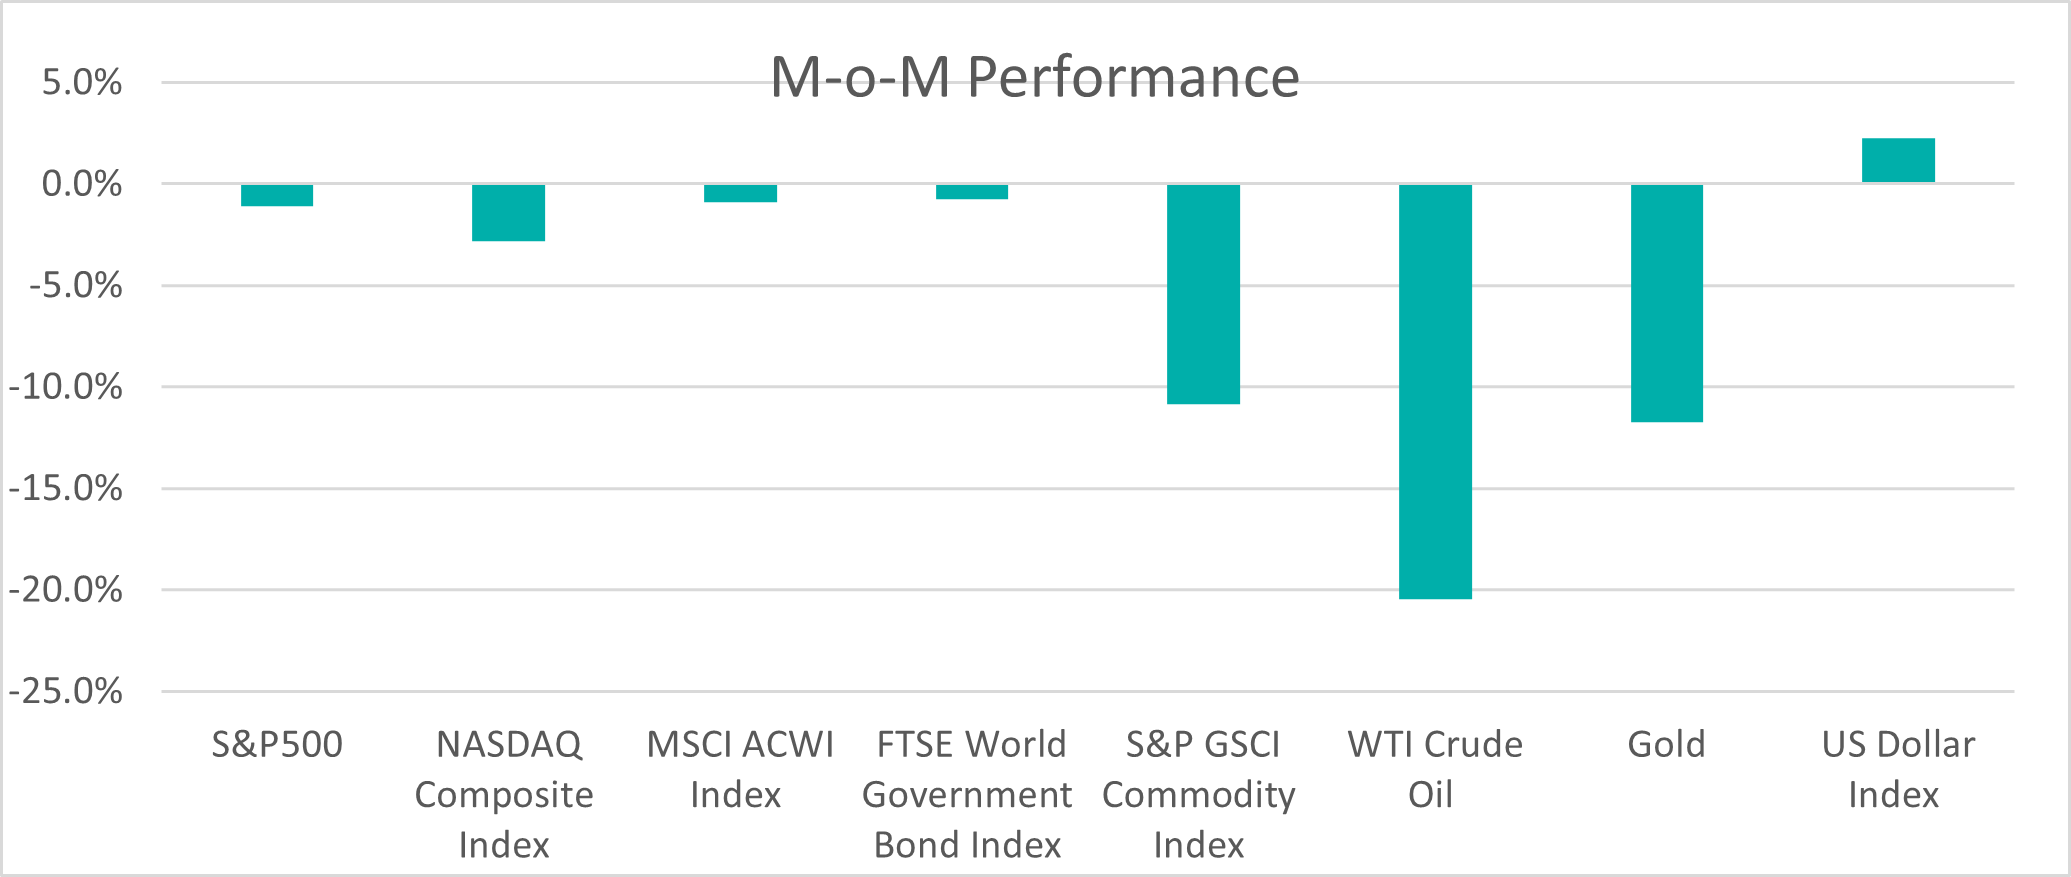
Chart 1: Index Performance in June 2026.
Equity markets consolidated in June 2026 as investors took profits after an exceptionally strong rally in AI, chip and data centre related stocks. The S&P 500, Nasdaq Composite Index and MSCI All-World Index declined by 1.1%, 2.8% and 0.9% respectively. Investors rotated into more defensive and value-oriented sectors / countries such as US industrial stocks and European equities.
The 2-year Treasury yield rose to 4.17% from 4% in May as markets started pricing a greater risk that rates would stay elevated for longer due to sticky inflation and more hawkish Fed projections. As at end-June 2026, CME FedWatch data indicated a 33.14% chance of 25bps rate hike at the Fed’s upcoming 29 July 2026 meeting.
The WTI oil price declined by 20% in June to settle near $70 per barrel at month-end. The drop was driven by the formal signing of the US-Iran peace agreement on June 19th. Similarly, gold dropped 12% as safe-haven demand eased. Bitcoin fell to $59,513, driven by the same macro forces that hit tech stocks and other risk assets.
The US dollar strengthened against the Malaysian Ringgit, ending June-2026 at 4.084, from 3.9645 in end-May 2026. In 2026, the Malaysian ringgit appreciated by 0.6% against the U.S. dollar.
Outlook
US inflation remained high, with recent data showing CPI print of +4.2% year-on-year (YoY). This annual reading marked the highest headline rate since April 2023, driven primarily by energy costs. The labour market remains relatively stable, with low unemployment and modest employment growth. The resilience of the labour market, coupled with elevated inflation, left the Fed with little urgency to begin cutting rates.
At its June 2026 meeting, the Fed kept the policy rate unchanged at 3.50%–3.75%. The meeting was interpreted as hawkish as policymakers emphasized persistent inflation risks and revised their rate outlook higher; the central bank projects a 3.8% year-end policy rate and 9 of the 19 FOMC participants expect at least 1 additional rate hike before year-end.
China’s economic data were mixed, with retail sales falling 0.6% YoY and fixed asset investment contracting 4.1% year-to-date, while industrial production remained relatively resilient at 4.5% YoY, exceeding market expectations. High-tech manufacturing continued to outperform, growing 15.1% YoY. The Purchasing Managers Index (PMI) rose to 50.3, above expectations of 50.1 and marking a 3rd consecutive month in expansion.
June brought profit-taking in tech names alongside gains in value, cyclical and small-cap equities. Top gainers in June were industrials (+2.4%), consumer staples (+1.2%) and utilities (+1.8%). Conversely, the energy sector fell 4.2% following the US-Iran peace deal, while information technology dropped 3.5% for the month.
US trade policy turned more restrictive in June, with the USTR proposing new Section 301 tariffs of 10 – 12.5% on dozens of economies and expanding trade enforcement measures. The measures were framed around labour standards and forced-labour concerns, including supply chains involving countries such as Malaysia, but also underscored the administration’s preference for using trade policy and tariff mechanisms to advance a wider range of policy objectives.
Citation:
https://www.cmegroup.com/markets/interest-rates/cme-fedwatch-tool.html
Disclaimer
Kenanga Digital Investing (“KDI”) is licensed by the Securities Commission of Malaysia as a Digital Investment Management Company. KDI is authorised to carry out the business of fund management blending innovative technology into automated portfolio management services offered to clients under a license issued pursuant to Schedule 2 of the Capital Markets Services Act (CMSA) 2007.
Investment involves risk, including the possible loss of capital you invest. Past performance does not indicate future performance. Historical returns, expected returns, and probability projections are provided for informational and illustrative purposes, and may not reflect actual future performance. KDI does not assume any fiduciary responsibility or any liability for any consequences, financial or otherwise, arising from any transaction in reliance on such information. Investors should rely on their own evaluation or consult an independent financial, accounting, tax, legal or other professional advisers to access the merits and risks before investing.
Any forward-looking statements, predictions, projections or forecast on the economy, stock market, bond market or economic trends of the markets contained in this material are subject to the market influences and contingent upon matters outside the control of KDI and therefore may not be realised in the future. No representation is made as to the completeness and adequacy of the information to make an informed decision.
Neither the information, nor any opinion, contained in this article constitutes a promotion, recommendation, solicitation, invitation by KDI or its affiliates to buy or sell any securities, investment schemes or other financial instruments or services, nor shall any security, collective investment scheme, or other financial instruments or services be offered or sold to any person in any jurisdiction in which such offer, solicitation, purchase, or sale would be unlawful under the securities laws of such jurisdiction. This is not intended to be an invitation or offer made to the public to subscribe for any financial product or other transaction.
This information has not been reviewed by the Securities Commission of Malaysia.