Was Hiding Even an Option?
Executive Summary
October offered investors little shelter, with every risk profile ending the month lower. Our models remain constructive on equities, with fixed income, commodities and cash on hand to steady the ride. In a market this jumpy, we recommend DCA to take the guesswork out of staying invested. Welcome to the November edition. October turned out rockier than most expected, and for once there were few places to hide. The tech-heavy Nasdaq tumbled 5.3%, the S&P 500 slipped 0.9%, and even gold, the usual safe harbour, fell around 7%. KDI portfolios weren’t spared either, with returns across risk profiles ranging from -2.8% to -0.8% for the month. Diversification softened the blow, particularly against the tech sell-off, but it can’t make a down month disappear. What it can do, however, is keep you invested long enough for the good months to count.
Beneath a nearly flat S&P 500, last month was a month of sharp rotation. Investors pulled out of the AI trade, leaving technology and communication services to bear the brunt, and piled into the market’s quiet corners. Energy gained 14% on surging crude, while consumer staples (+11.4%) and utilities (+10.1%) posted double-digit gains, rare territory for sectors usually picked for their ‘calmer’ disposition. Bonds caught a bid as well, with 2-year and 10-year U.S. Treasury yields falling 30-36 basis points as a weak September jobs print of just 29,000 sent investors looking for safety. Bitcoin, meanwhile, fell 7.5%.
We believe it’s only fair that we address the elephant in the room and break down exactly what happened in October. First, investors are questioning whether the AI boom can keep paying its way. After piling cash into the AI race in the first half, scrutiny turned to massive capital spending, cash burn and a growing reliance on debt to fund data centres. Second, conflicts in the Middle East are far from over. Attacks on tankers in the Strait of Hormuz and on Saudi energy facilities pushed WTI crude up 15% for the month. Third, borrowing costs look set to stay higher for longer.U.S. inflation climbed to 3.7% in September. Two Fed officials voted for another hike at the October meeting. And by month-end, futures were pricing a 71% chance of a hike at the upcoming December meeting. Heavy borrowers within the AI space might find themselves in a tight spot as a result.
Looking back at history, choppy markets are not an uncommon sight. During the height of the U.S.-Iran conflict in the spring, our models turned defensive to preserve capital, before rotating back into equities and commodities in May as ceasefire prospects improved. That hasn’t spared portfolios from a soft patch since. Zoom out, however, and four of our five our portfolios remain up by double digits since the inception in 2022, between 10.4% and 15.9%
Our models are built to sit through months like this by staying diversified across asset classes and regions rather than chasing whatever happens to be winning in the short run.
A Note to Our Clients
October was a tough month to watch, and if it left you a little uneasy, you are not alone. Nobody enjoys their portfolio to a sea of red, and we won’t pretend otherwise. But temperamental months are part of the deal with long-term investing, and the reward for sitting through them is compounding.
With that in mind, we would like to share a few reminders that still ring true today:
1. Dollar-cost averaging (DCA), or investing a fixed amount at regular intervals, remains a solid strategy in the current climate as it takes the pressure off investing at the ‘right’ moment and eases the psychological pain of investing in the current climate. Research also shows that regular investing beats waiting on the sidelines;
2. Markets historically have tended to move upwards over time. Historical data shows that missing just the 10 best days over the past 20 years would have cut S&P 500 returns by more than half. The caveat here is to remain invested and resist the urge to realise your losses too early; and finally
3. The only, true ‘free lunch’ in the markets is diversification. Performance across asset classes flips more often than one might think, year-by-year. This goes to show that timing the market and betting on one single asset class is incredibly difficult without divining a crystal ball.
While we navigate through the unease, we remain committed to investing your capital systematically for the long-term. Depending on your risk profile, our models will continue to hold equities for long-term growth, balancing with fixed income, commodities and cash to cushion short-term swings. If you’d like to revisit your risk profile or talk through your portfolio, our team is always happy to hear from you. As always, we encourage our clients to stay on course with a globally diversified portfolio.
Fund Performance Highlights
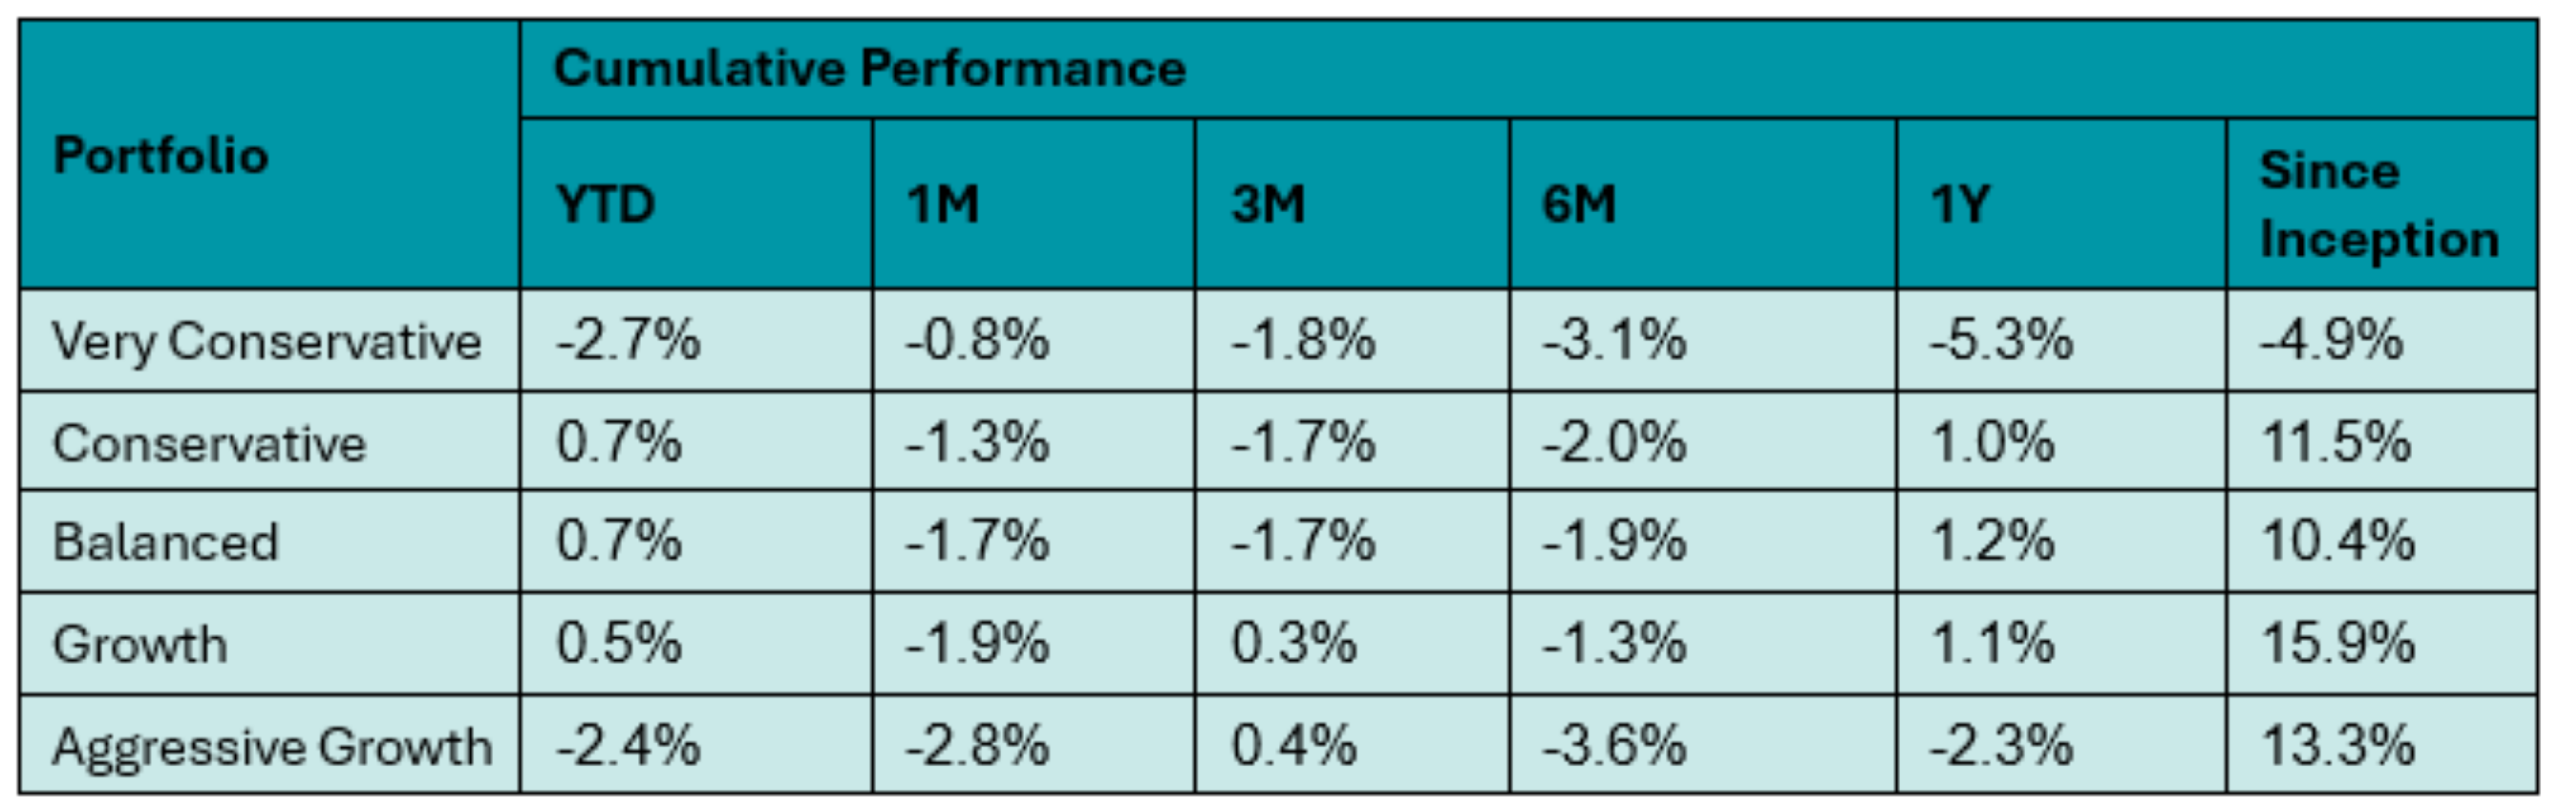
Table 1: KDI Invest Portfolio Performance (as of 31 October 2026).
The provided table offers information on the cumulative performance of selected KDI portfolios since their launch on February 15, 2022. The portfolio returns (in USD) range from -4.9% to 13.3%. In 2026, the portfolios recorded returns within a range of -2.7% to 0.7%.
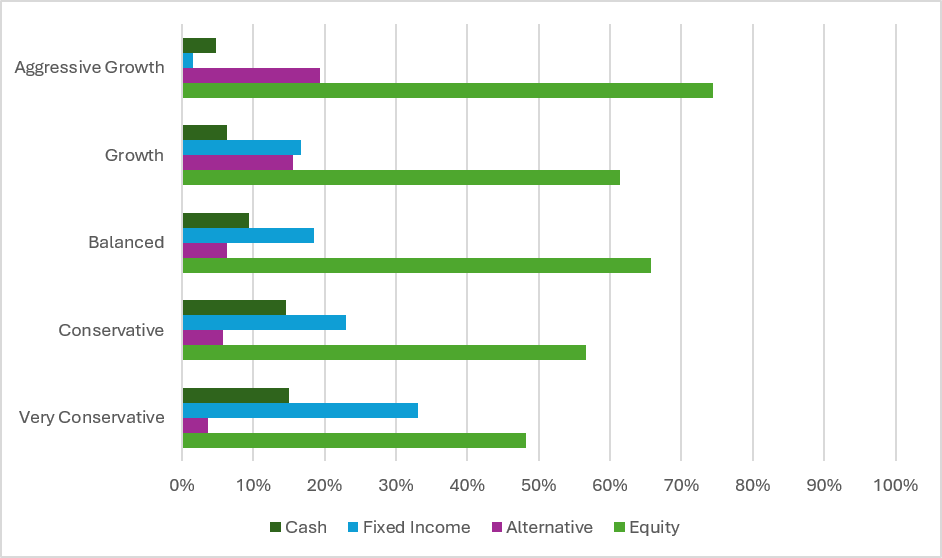
Chart 2: Asset Class Exposure (as at 31 Oct 2026).
Despite recent monthly turbulence, the model’s multi-factor framework remains constructive on equities. We maintain a balanced, systematic stance: capturing long-term upside in equities while relying on fixed income, commodities and cash to absorb short-term volatility.
Kindly note that the performance and asset class exposure illustrated above are derived from five proxy portfolios. The actual performance and exposure of your investment portfolio may differ due to the customisation made by our proprietary algorithms that tailors the investment to your unique risk profile, as well as the timing of market entry.
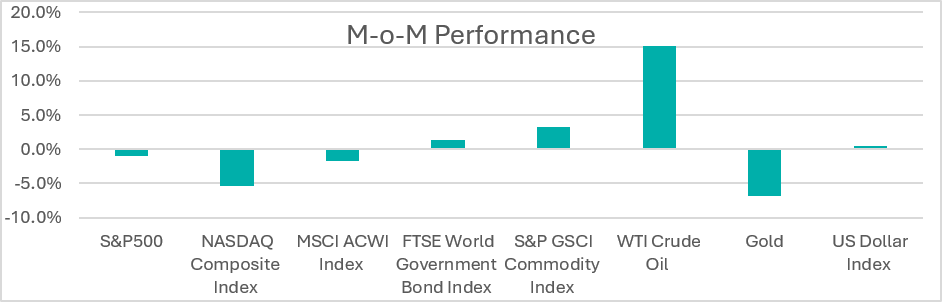
Chart 3: Performance in October 2026.
October was characterised by a broad risk-off rotation as investors reduced exposure ahead of the November U.S. midterm elections, reassessed crowded AI-related positions, and shifted towards defensive assets. The S&P 500 and MSCI All Country World Index declined by 0.9% and 1.7% respectively for the month, while the tech-heavy Nasdaq Composite Index tumbled by 5.3%.
Both the 2-year and 10-year US Treasury yields moved lower by 30 – 36 basis points in October, thanks largely to risk reduction ahead of the US midterm elections. As at end-October 2026, CME FedWatch data indicated a 71% chance of 25bps rate hike at the Fed’s upcoming 9 Dec 2026 meeting.
Oil (WTI) gained 15% in October primarily due to renewed Middle East supply disruptions, e.g. Houthi strikes on Saudi oil infrastructure. Despite elevated geopolitical risk, gold fell in October as the market priced in hawkish Fed rate expectation – a rate hike increases the opportunity cost of holding gold. Cryptocurrencies traded in line with global assets, with Bitcoin down by 7.5% on reduced risk appetite.
The US dollar depreciated against the Malaysian Ringgit, ending Oct-2026 at 4.0582, from 4.0798 in end-Sept 2026. In 2026, the Malaysian ringgit has appreciated by 0.1% against the U.S. dollar.
Outlook
US 3rd quarter GDP growth beat expectations at 3.4% (vs. consensus of 3.2%). However, headline inflation came in hotter than expected at 3.7% year-on-year (YoY) due to a sharp energy price surge. Nonfarm payroll gains cooled significantly to 29,000 jobs, which is a sizeable drop from 162,000 jobs added in August and market expectations of 85,000 – 98,000 new jobs.
The Fed left its federal funds target range unchanged at 3.75-4.00% at its 27-28 October meeting, with the vote split 10-2 reflecting ongoing concern among some policymakers that inflation remains above target. Heading into the December FOMC meeting, the Fed must balance the competing pressures of a cooling labour market against sticky, energy-driven inflation.
China’s 3rd quarter GDP expanded by 4.5% YoY, beating forecasts of 4.4% as strong high-tech industrial output offset domestic demand drag. October’s manufacturing PMI unexpectedly slipped into contraction at 49.3 due to weak construction activity, while selected segments such as high-end manufacturing, semiconductors, EV and industrial automation continued to expand. Chinese officials reiterated confidence that ongoing macro stimulus will keep full year GDP within Beijing’s official target range of 4.5%-5%.
In October, the US equity market experienced a rotation from mega-cap tech to value, energy and defensive sectors. Energy was the top gainer for the month (+14%) due to surging crude oil prices. Defensive sectors such as Consumer Staples (+11.4%) and utilities (+10.1%) saw large inflows as investors sought safe and/or high yield stocks. In contrast, Technology and Communication Services underperformed as investors grew weary of soaring AI infrastructure spending.
U.S. trade policy in October focused on industrial supply chains rather than consumer imports. The White House targeted robotics and advanced manufacturing machinery under national security provisions, while fine-tuning custom rules to clarify exactly which motor vehicle components and capital goods trigger tariff duties. Should these talks end in tariffs, higher costs for factory equipment could weigh on corporate margins and cool the earnings cycle in the medium term.
So, is hiding even an option? October suggests not. The alternatives offer little shelter when the AI trade unwound, and even a rally in bonds wasn’t enough to keep portfolios in the green. Into December, markets will be watching the Fed’s December rates decision and oil’s grip on inflation. The more useful question is how to stay invested comfortably. For most investors, that means a diversified portfolio together with a regular contribution plan they can stick with through months like this one.
Citation:
https://www.cmegroup.com/markets/interest-rates/cme-fedwatch-tool.html
https://www.reuters.com/world/us/us-economic-growth-accelerates-third-quarter-2026-10-29/
Disclaimer
Kenanga Digital Investing (“KDI”) is licensed by the Securities Commission of Malaysia as a Digital Investment Management Company. KDI is authorised to carry out the business of fund management blending innovative technology into automated portfolio management services offered to clients under a license issued pursuant to Schedule 2 of the Capital Markets Services Act (CMSA) 2007.
Investment involves risk, including the possible loss of capital you invest. Past performance does not indicate future performance. Historical returns, expected returns, and probability projections are provided for informational and illustrative purposes, and may not reflect actual future performance. KDI does not assume any fiduciary responsibility or any liability for any consequences, financial or otherwise, arising from any transaction in reliance on such information. Investors should rely on their own evaluation or consult an independent financial, accounting, tax, legal or other professional advisers to access the merits and risks before investing.
Any forward-looking statements, predictions, projections or forecast on the economy, stock market, bond market or economic trends of the markets contained in this material are subject to the market influences and contingent upon matters outside the control of KDI and therefore may not be realised in the future. No representation is made as to the completeness and adequacy of the information to make an informed decision.
Neither the information, nor any opinion, contained in this article constitutes a promotion, recommendation, solicitation, invitation by KDI or its affiliates to buy or sell any securities, investment schemes or other financial instruments or services, nor shall any security, collective investment scheme, or other financial instruments or services be offered or sold to any person in any jurisdiction in which such offer, solicitation, purchase, or sale would be unlawful under the securities laws of such jurisdiction. This is not intended to be an invitation or offer made to the public to subscribe for any financial product or other transaction.
This information has not been reviewed by the Securities Commission of Malaysia.