March 2024 Market Insights

Welcome to the March edition of the Market Insights column brought to you by the Kenanga Digital Investing (KDI) team. In this edition, Our Head of Digital Investing, Cheong Yew Huan, will discuss the latest financial news and share his insights on how to make the most of today’s market.
Market Recap
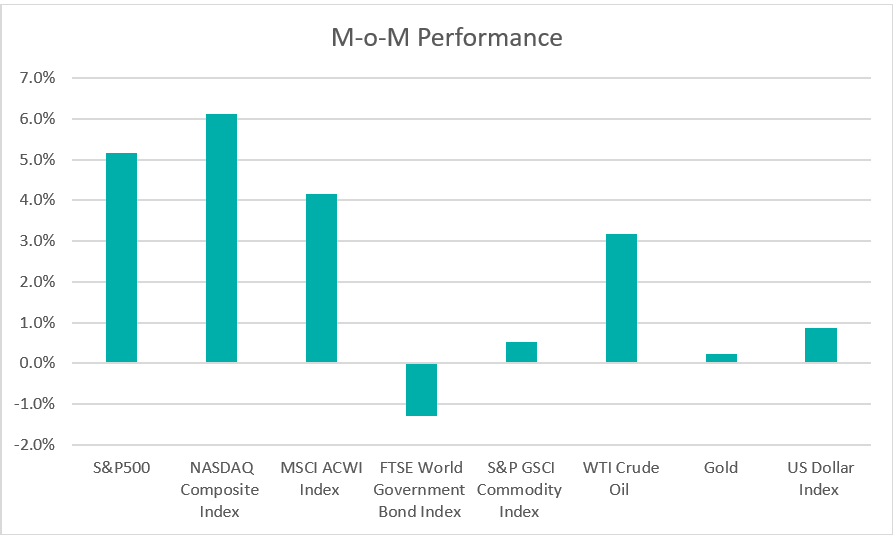
Chart 1: Index Performance in February 2024

Market
In February, the S&P 500 stock index surpassed 5,000 points for the first time, hitting a record high, while the Nasdaq Composite Index also rose by 6.1%. The MSCI ACWI Index, which measures stock performance worldwide, increased by 4.2%, marking its fourth consecutive month of gains. The equity rally was driven by better-than-expected earnings from major technology companies such as Meta Platforms, Nvidia, and Amazon.com. Additionally, the healthy job market in the US made investors feel more optimistic and boosted confidence in the market.
The fixed-income market was under pressure as the FTSE World Government Bond Index decreased by 1.3% during the month. This decline was accompanied by notable shifts in US Treasury yields, with the two-year Treasury yield surging by 41 basis points to reach 4.6187%, and the 10-year yield rising by 33.8 basis points to 4.2502%—its highest level since December of the previous year. The rally in US Treasury yields was driven by changing expectations regarding the Federal Reserve’s stance on interest rates, with investors anticipating potential rate cuts as early as June this year.
The commodity market saw modest gains, with the S&P GSCI Commodity Index rising by 0.5%. The price of gold remained relatively stable, trading above US$2,000 per ounce throughout the month, buoyed by market expectations for potential rate cuts in the upcoming June FOMC meeting. Conversely, ongoing geopolitical risks in regions like Ukraine and the Middle East continued to bolster oil prices, with WTI Crude Oil climbing by 3.2% to US$78.26 per barrel.
The dollar index jumped to a four-month peak, gaining 0.9% over the month to close at 104.16.
Outlook
In February, notable performances came from five of the ‘Magnificent Seven’ US stocks, which reported their 4Q2023 results. These companies largely met or surpassed expectations, significantly contributing to the S&P 500’s gains over the month. According to a FactSet report released on February 29, 2024, 97% of the companies in the S&P 500 have reported actual results for Q4 2023 to date. Of these companies, 73% of S&P 500 companies have reported a positive EPS surprise. The sectors leading these positive earnings surprises include Information Technology, Industrials, Consumer Discretionary, and Health Care sectors, partially offset by negative earnings surprises reported by companies in the Financials sector, have been the largest contributors to the increase in overall earnings for the index since the end of the quarter. Recent economic data further highlights the resilience of the US economy, with the unemployment rate maintained at 3.7% for three consecutive months. January’s inflation rate, as measured by the Consumer Price Index, stood at 3.1%, down from the 3.4% recorded in December 2023 and about a third of the high point of 9.1% seen in June 2022.
In response to market instability, the Chinese government implemented several supportive measures to restore financial stability, including a 25-basis point reduction in the five-year loan prime rate, curbing short-selling by suspending brokerages from borrowing shares for lending, and capping the size of securities refinancing. As a result, the Chinese equity markets rebounded from recent lows during the month. The Chinese economy is expected to continue facing challenges stemming from weak consumer confidence and a complex external environment. Deflationary pressures still persist, with China’s producer prices declining for the 16th consecutive month in January, while consumer prices recorded their fourth consecutive annual decline of 0.8%.
Table 1: KDI Invest Portfolio Performance As at 29 February 2024

The provided table offers information on the cumulative performance of selected KDI portfolios since their launch on February 15, 2022. The portfolio returns (in USD) range from –5.5% to -1.9%. In February 2024, all portfolios recorded positive returns within a range of 1.2% to 3.5%.
The better-than-expected US corporate earnings, healthy jobs data, and declining inflation have supported the outperformance of equities. Artificial intelligence-related stocks have propelled the stock markets, with the S&P 500 reaching all-time highs. Meanwhile, bonds have faced headwinds from rising yields as bond investors react to the potential Fed rate-cutting cycle. As the corporate earnings season winds down, the economic data, rate cut timing by central banks, and the US presidential election, which will be the biggest drivers of global markets this year.
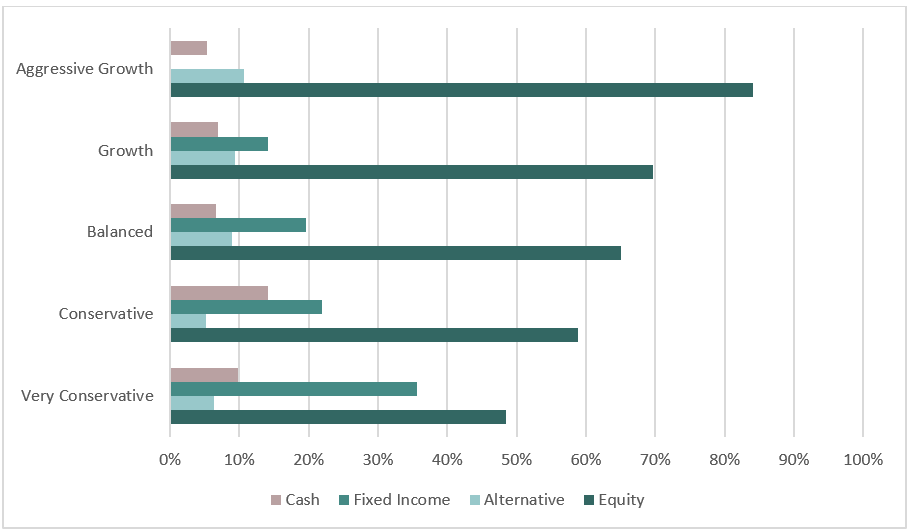
The portfolio strategy remains intact with multi-asset and global diversification. Equity exposure currently ranges between 48% and 84%. Key holdings include Vanguard Total Stock Market Index (VTI), Vanguard 500 Index Fund ETF (VOO), and Invesco QQQ Trust Series 1 (QQQ). Fixed income constitutes an allocation of up to 39%, with holdings including iShares National Muni Bond ETF (MUB) and iShares iBoxx $ Inv Grade Corporate Bond ETF (LQD). Cash holdings range from 5% to 14%.
Chart 2: Asset Class Exposure As at 29 February 2024

Please note that the performance and asset class exposure mentioned above are derived from five proxy portfolios. The actual performance and exposure of KDI Invest portfolio may differ due to the customisation by our A.I. based robo-advisor, which tailors investment to individual risk profiles, as well as the timing of market entry.
Citation:
https://insight.factset.com/earnings-insight-infographic-q4-2023-by-the-numbers
https://www.channelnewsasia.com/business/china-financial-markets-curbs-short-selling-4102676


