September 2023 Market Insights

Brought to you by the Kenanga Digital Investing (KDI) team, here is our 20th Market Insights column. Our Head of Digital Investing, Cheong Yew Huan will discuss the latest in financial news and present his thoughts on making the most of today’s market.
Market Recap
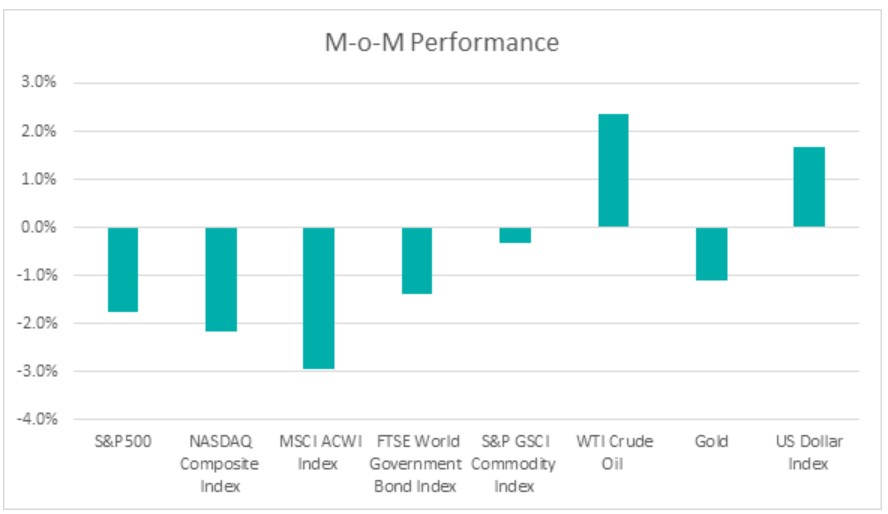
Chart 1: Index Performance in August 2023

Market
In August, U.S. stocks experienced a decline, marking their first monthly decrease since February, with the S&P 500 and Nasdaq-Composite Indices declining 1.8% and 2.2%, respectively. This decrease was driven by Fitch’s decision to downgrade the U.S. credit rating from AAA to AA+, citing concerns about fiscal deterioration over the next three years and an increasing government debt burden. This marked the second time a major rating agency had downgraded the country’s credit rating, following Standard & Poor’s move in 2011. Furthermore, global stocks faced challenges due to the turmoil in China’s property sector, contributing to a 3.0% drop in the MSCI All Country World index during the same month.
The U.S. bond market experienced a notable period of selling pressure during the three weeks of the month. The selloff was attributed to the U.S. debt downgrade by Fitch Ratings and the Treasury Department’s heightened issuance of bonds. Consequently, 10-year U.S. Treasury yields underwent a significant shift, rising from below 4% to reach as high as 4.366%, marking the highest level seen since 2007 before settling at 4.1% at the end of the month. The two-year U.S. Treasury yield, which serves as an indicator of market expectations regarding interest rates, closed at 4.8525%.
In the commodities market, WTI Crude Oil prices continued their upward trend for the third consecutive month, closing with a 2.3% increase in August. The increase in oil prices was primarily attributed to the commitment of Saudi Arabia and Russia, which rank as the second and third-largest crude producers globally, to reduce their output in September. Meanwhile, the price of gold remained steady, trading above the USD1,900 level, despite the presence of a stronger dollar and higher bond yields in the market.
The US Dollar Index recorded a 1.7% increase in August, putting an end to its two-month period of decline. This surge was primarily driven by the hawkish stance adopted by Federal Reserve policymakers. Despite the recent Fitch downgrade of the US government’s debt, there was a resurgence in interest in the US Dollar as a safe-haven currency. The strengthening of the US Dollar was underpinned by the resilience of the US economy and market participants’ concerns regarding the unevenness of China’s economic rebound.
Outlook
The U.S. economy has demonstrated resilience despite elevated interest rates, tighter credit conditions, and a challenging global economic environment. The Personal Consumption Expenditures price index (CPE), the Fed’s preferred measure of inflation, increased by 0.2% month-on-month and 3.3% year-on-year in July. As the inflation rate was cooling down, it raised investors’ expectations that the Federal Reserve will keep interest rates unchanged in the upcoming months.
While there is growing optimism that the U.S. central bank’s rate-hiking cycle may be nearing its conclusion and may even consider rate cuts next year, as indicated by CME Group’s FedWatch Tool, Federal Reserve Chairman Jerome Powell’s speech at the annual Jackson Hole conference signaled that interest rates will stay high, and the Federal Reserve may need to raise interest rates further if appropriate to ensure inflation is contained and to hit its inflation target of 2%.
China’s post-Covid recovery is facing significant challenges, including a property crisis, declining exports, and subdued consumer spending. One notable event during the month was the spotlight on China’s largest private property developer, Country Garden, which issued warnings of potential default risks if its financial performance continued to worsen. Furthermore, China’s factory activity experienced its fifth consecutive month of contraction in August, with the official Manufacturing Purchasing Managers’ Index registering at 49.7 from 49.3 in July, according to data from the National Bureau of Statistics. Exports declined by 14.5% in July compared to the previous year, marking the third consecutive month of decrease due to weakened global demand. In addition, the Consumer Price Index (CPI) in China fell by 0.3% last month compared to the same period a year ago, marking the first instance of deflation in the country’s economy in two years.
The Chinese economy is now under the pressure of deflation, which underscores the need for urgent government interventions to stimulate economic activity. China’s central bank unexpectedly reduced key policy rates for the second time in three months. There are growing concerns that the Chinese economy may not meet its growth target of around 5% this year amid a prolonged property crisis and weak global economic growth.
Table 1: KDI Invest Portfolio Performance As at 31 August 2023

Remarks:
Benchmark: Equity: MSCI ACWI Index + Fixed Income: FTSE World Government Bond Index
Past performance is not indicative of future results.
The provided table offers information on the cumulative performance of selected KDI portfolios since their launch on February 15, 2022. Year-to-date, all portfolios have recorded returns within a range of -0.5% to 6.1%.
The global economic landscape is currently characterized by significant disparities. The United States has posted unexpectedly robust economic growth, marked by a low unemployment rate and a decrease in inflation from its peak. In contrast, China, the second-largest economy globally, faces challenges arising from a weakening property sector and the looming risk of deflation. Meanwhile, the Eurozone is experiencing a slowdown in growth, with a mere 0.3% annualized growth rate in the second quarter, as reported by Eurostat, the statistical office of the European Union.
From an asset class perspective, although equities have performed well year-to-date, fixed income is becoming increasingly appealing to investors. This shift is influenced by the fact that global interest rates are relatively high, coupled with growing expectations of an impending recession.
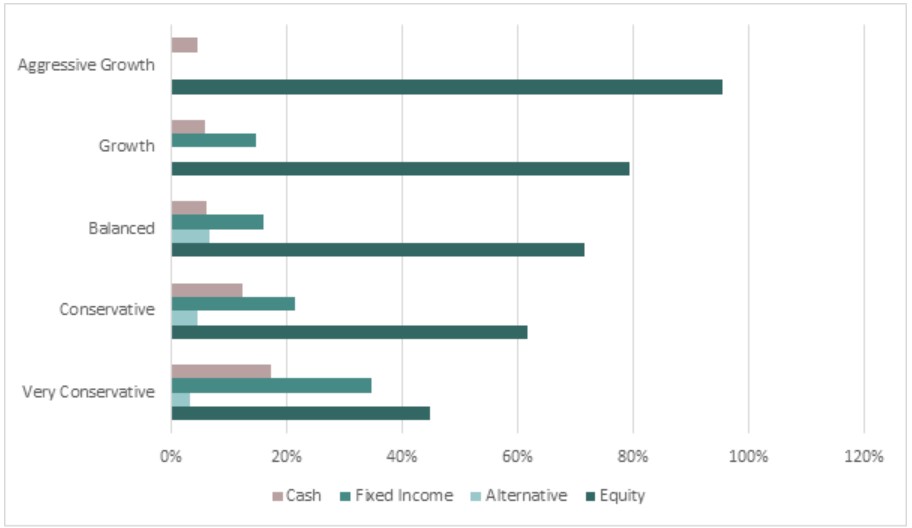
The KDI portfolios maintain diversification, allocating a significant portion of their assets to equity exposure, ranging from 45% to 96%. Fixed income investments comprise up to 35% of the portfolio, while alternative investments, primarily in the gold ETF (GLD), make up to 7%. Additionally, cash holdings within the portfolios range from 4% to 17%.
Chart 2: Asset Class Exposure As at 31 August 2023


