September 2024 Market Insights

Welcome to the September edition of the Market Insights column brought to you by the Kenanga Digital Investing (KDI) team. In this edition, Our Head of Digital Investing, Cheong Yew Huan, will discuss the latest financial news and share his insights on how to make the most of today’s market.
Market Recap
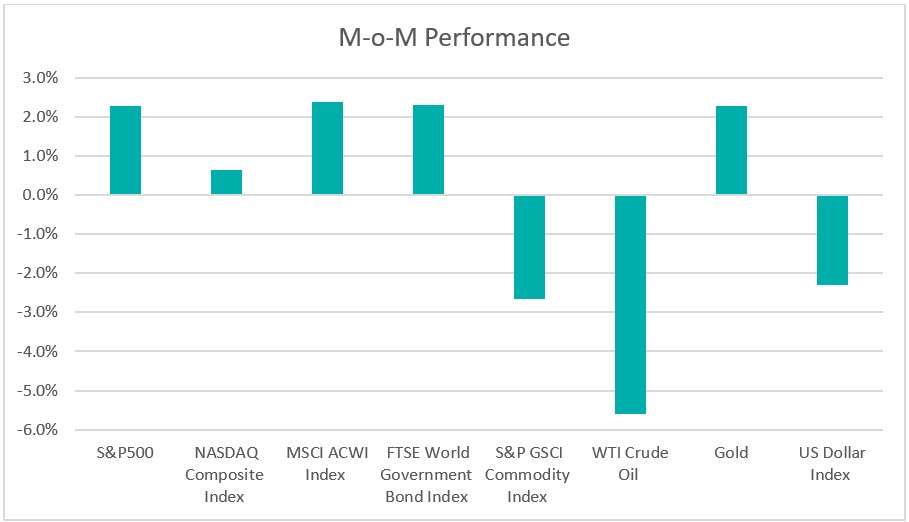
Chart 1: Index Performance in August 2024

Market
Global equity markets recorded their fourth consecutive month of gains in August, despite early volatility, driven by signs of a cooling U.S. economy leading to a dovish position from the Federal Reserve. The MSCI ACWI Index increased by 2.4% during the month. U.S. stocks benefited from signs of easing inflation and expectations of FOMC rate cuts, with the S&P 500 rising 2.3% and nearing an all-time high. However, Nvidia’s earnings forecast fell short of expectations, negatively impacting technology stocks. Although the Nasdaq inched up 0.3%, the sharp decline in Nvidia and other AI-related companies led to a brief pullback in the technology sector.
The yield on the 10-year U.S. Treasury fell 12 basis points to 3.9034%, while the 2-year yield dropped 34 basis points to 3.9165%. This marked the fourth consecutive monthly decline in U.S. Treasury yields. The Treasury yield curve flattened as both short- and long-term rates decreased. The decline in yields was driven by market speculation that the Federal Reserve might start cutting rates as early as September, with recent comments from Fed Chair Jerome Powell at Jackson Hole hinting at potential policy changes.
In the commodities market, oil prices fluctuated, with WTI crude oil falling 0.6% to US$73.55 per barrel. Weak global demand and concerns over a possible reversal of OPEC+ production cuts added downward pressure on prices. Geopolitical tensions, particularly in the Middle East, contributed to the volatility, but easing supply concerns helped stabilize the market. Meanwhile, gold prices climbed 2.3% for the month, surpassing US$2,500 per ounce, driven by expectations of U.S. rate cuts.
The U.S. Dollar Index declined by 2.3% to 101.70, as growing expectations of Federal Reserve rate cuts diminished the dollar’s yield advantage.
Outlook
The U.S. economic data is mixed, showing resilience amid a gradual cooling of the labor market and inflationary pressures. While economic growth in the second quarter was revised upward to an annualized rate of 3.0%, driven primarily by strong consumer spending, the unemployment rate increased to 4.3%, the highest in nearly three years. Inflation has continued to ease, with the personal consumption expenditures (PCE) price index rising 0.2% in July and the annual inflation rate slowing to 2.5%. This brings inflation closer to the Federal Reserve’s 2% target and sets the stage for the Fed to potentially cut interest rates at the September FOMC meeting. While there is market anticipation of a 50-basis-point rate cut, most economists expect a more cautious 25-basis-point reduction as the Fed balances risks to both growth and inflation. Overall, the U.S. economy is positioned for a soft landing, with expectations of monetary policy adjustments in September to support sustained growth while mitigating inflationary pressures.
Meanwhile, China’s economy is struggling to recover, with factory activity contracting for the fourth consecutive month in August, signalling difficulties in meeting this year’s growth targets. In August, new-home sales from major real estate firms fell 22% year-on-year, worsening from the previous month’s decline. Industrial profits increased by 4.1% in July, showing some positive momentum, but industrial output growth slowed to 5.1%, missing expectations and highlighting ongoing weaknesses. Consumer and business borrowing remains subdued. The People’s Bank of China is expected to continue cutting interest rates to stimulate the economy. In general, China’s economy is struggling with weak domestic demand and a troubled property sector, posing challenges for achieving growth targets.
Table 1: KDI Invest Portfolio Performance as at 31 August 2024

The provided table offers information on the cumulative performance of selected KDI portfolios since their launch on February 15, 2022. The portfolio returns (in USD) range from -1.0% to 5.5%. Year-to date, all portfolios recorded positive returns within a range of 5.4% to 15.0%.
Equities rebounded from the sharp sell-off in July, with the S&P 500 rising close to historical highs. This rally has been driven by expectations that the central bank will begin lowering rates in September. Although equities continue to climb, other asset classes have shown more defensive movements: the U.S. dollar has depreciated, gold has reached $2,500, and U.S. Treasury yields have fallen. These movements suggest that investors are growing more concerned about the U.S. economic outlook and are anticipating a soft landing in the coming quarter.
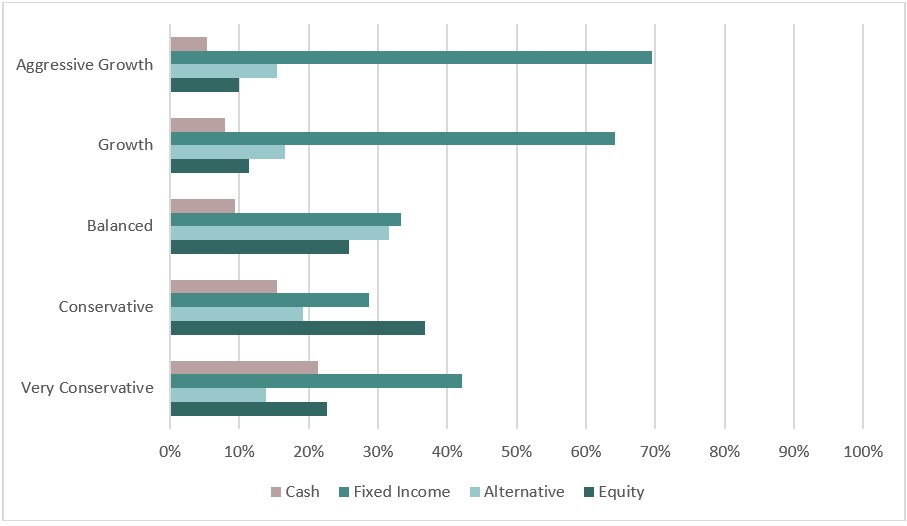
Assuming inflation remains stable, key economic data such as job figures, the unemployment rate, and the FOMC’s monetary policy decisions will be key drivers of market movement. The KDI AI has adjusted its portfolio allocations by reducing its overweight position in equities and diversifying allocations to fixed income, alternative investments, and cash. After these adjustments, the KDI portfolios remain diversified to manage market volatility, with equity allocations ranging from 10% to 37%, fixed income making up to 69%, alternative investments up to 32%, and cash holdings between 5% and 21%.
Chart 2: Asset Class Exposure as at 31 August 2024

Please note that the performance and asset class exposure mentioned above are derived from five proxy portfolios. The actual performance and exposure of KDI Invest portfolio may differ due to the customisation by our A.I. based robo-advisor, which tailors investment to individual risk profiles, as well as the timing of market entry.
Citation:
https://www.cnbc.com/2024/08/30/pce-inflation-july-2024.html


