April 2022 Market Insights

Brought to you by the Kenanga Digital Investing (KDI) team, here is our third Market Insights column. Our Head of Digital Investing, Cheong Yew Huan will discuss the latest in financial news and present his thoughts on making the most of today’s market.
Market Recap

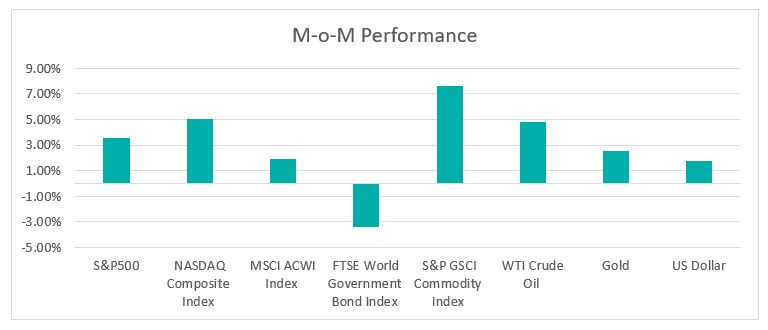
Chart 1: Index Performance in March
Equities have rebounded from the low in mid-March and posted a positive return during the month. Despite the positive return in March, the S&P500 and Nasdaq Composite Index were down 4.9% and 7.7% respectively in the first quarter of 2022, the biggest quarterly decline since the pandemic outbreak in 1Q 2020. Meanwhile, the FTSE World Government Bond Index decreased by 3.4% in March, as the concerns on surging inflationary pressure, the rate hike cycle led by the Federal Reserve, and the impact of Russia’s invasion of Ukraine weighed on both equities and fixed income.
The commodity continues to move higher as WTI Crude oil surged to US$123.70 per barrel before pulling back to US$100.38 per barrel. The pullback of crude oil in late March was due to optimism surrounding Russia/Ukraine settlement talks and the US government announcement on the Strategic Petroleum Reserve release. WTI Crude Oil was up 33% in the first quarter and volatility is likely to continue, driven by geopolitical development and supply disruption
US inflation is now at a 40-year high, at 7.9% with the surge in energy and commodity prices that could still lead to further inflationary pressure. In comparison, the median inflation projection among FOMC members is 4.3% in 2022 and the Federal Reserve expects inflation only to return to 2% over time.
Mid-March, the Federal Reserve (Fed) raised rates for the first time since 2018. The Fed expects to raise rates six more times in 2022 and hinted that the central bank could take a more aggressive move, including 50 basis points increases, if necessary to curb inflation.
The Fed also announced that it will start reducing its balance sheet in May. Its balance sheet has ballooned to nearly US$9 trillion after carrying out quantitative easing by purchasing government bonds and other assets in response to the economic shutdown caused by the COVID-19 pandemic in March 2020.
Market Outlook
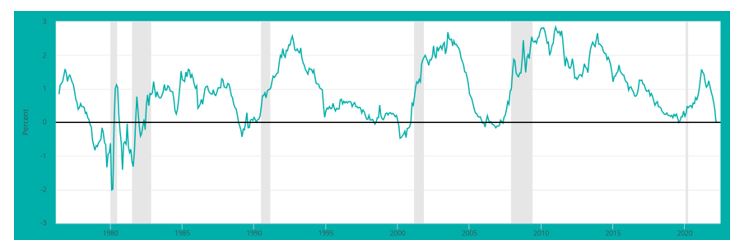
The bond market reacted negatively to the potentially aggressive move by Federal Reserve. The Treasury yield curve inverted on 1 April 2022 with the 10-year Treasury yield falling to 2.38%, six basis points below the 2-year Treasury yield of 2.44%.
The yield curve maps out US Treasuries of various durations and ordinarily, longer-dated Treasuries have higher yields than shorter-dated Treasuries. The yield curve inverts when yields on shorter-dated Treasuries rise above those longer-dated Treasuries. The yield curve inversion is an indicator that the economy could be heading for a downturn in the future. The recent cost-push inflation may trigger aggressive tightening policy by central banks. The higher interest rates may lead to higher borrowing costs, lower consumer spending, and lower economic growth.
For instance, the 2-year/10-year spread was last in negative territory in August 2019, before the COVID-19 pandemic lockdown in early 2020.
While the yield curve inversion is always associated with a recession, it does not provide much insight into the timing and magnitude of a recession. Nevertheless, since the 1960s, an inverted Treasury curve has been followed by a recession within two years.
Chart 2: 10-Year Treasury Constant Maturity Minus 2-Year Treasury Constant Maturity

Shaded areas indicate U.S. recessions
Source: Federal Reserve Bank of St .Louis
Major indices had recovered some losses in March and volatility eased off, with the CBOE Volatility Index (VIX) now below the psychological 20 levels, a key level to anticipate future market movement by traders and investors. However, with signs of yield curve inversion, investors are looking for more clues on the impact of inflation, the developments in Ukraine and Federal Reserve’s tightening monetary policy and balance sheet reduction in the coming month.
Portfolio Performance As at 31 March 2022

Remarks:
Benchmark: Equity: MSCI ACWI Index + Fixed Income: FTSE World Government Bond Index
Past performance is not indicative of future results.
The above table shows the performance of KDI portfolios since launched on 15 February. Despite the increase in volatility in equities and bond markets, the portfolio’s returns were ranging from -0.4% to 0.3% since launched on 15 Feb 2022. In March, the key contributors to portfolio performance were mainly equities ETFs, which include SPDR S&P500 ETF (+3.44%), Invesco QQQ Trust Series (+4.54%), Vanguard Total Stock Market Index Fund ETF (+2.94%) and Vanguard 500 Index Fund ETF (+3.44%). For fixed income ETFs, Vanguard Total International Bond Index Fund ETF was down 2.29% while iShares Short Treasury Bond ETF was merely unchanged during the month.
The high inflation is likely to persist for a longer period given the impact of Russia’s invasion of Ukraine. We expect the bond market is likely under pressure given the Federal Reserve turned hawkish and potentially more aggressive in hiking rates. The equities valuation has become more attractive after the pullback in the first quarter.
KDI portfolios are diversified globally and across various asset classes. KDI investment team will continue to monitor asset allocation and performance closely and ensure the investment risks are within the appropriate level.
Please note that the above performance is based on five proxy portfolios. Each KDI investor may vary from the above due to the portfolio customization by the KDI A.I. based on investors’ risk profiling.
