April 2024 Market Insights

Welcome to the April edition of the Market Insights column brought to you by the Kenanga Digital Investing (KDI) team. In this edition, Our Head of Digital Investing, Cheong Yew Huan, will discuss the latest financial news and share his insights on how to make the most of today’s market.
Market Recap
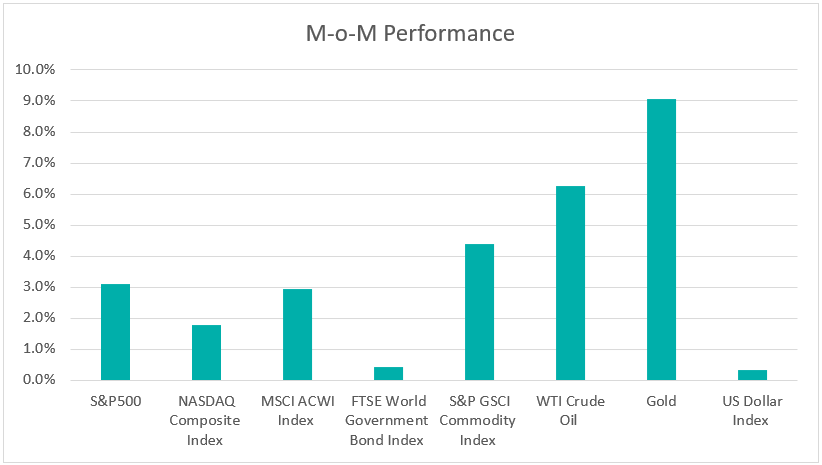
Chart 1: Index Performance in March 2024

Market
Global stock markets experienced their fifth consecutive month of growth, as indicated by the MSCI All-Country World Index rising by 2.9% in March. The US major indexes reached an all-time high during the month, fueled by significant gains in mega technology stocks and growing optimism following the Federal Reserve’s decision to maintain its projection of three rate cuts by the end of the year. Year-to-date, the S&P 500 and Nasdaq have risen by 10.2% and 9.1% respectively.
The FTSE World Government Bond Index returned +0.4% in March, with US Treasury yields declining modestly throughout the month. Investors reacted to the Federal Reserve’s latest decision to maintain its benchmark overnight interest rate steady in the 5.25%-5.50% range and its plan to ease three times before the end of the year. The 10-year Treasury yield decreased by nearly 5 basis points, reaching 4.2062%. The 2-year Treasury yield dropped by 2 basis points to 4.60347%. According to the CME FedWatch tool, the market is currently pricing in a 93% chance that the Federal Open Market Committee will continue to keep interest rates at their current levels at its next meeting in early May, and indicates a 60% probability of a Fed rate cut occurring in June.
The S&P GSCI Commodity Index continued its upward trajectory, rising by 4.4% over the month. Notably, oil prices emerged as one of the top performers, experiencing a 6.3% surge during the month. This surge was driven by OPEC+ production cuts, ongoing tensions in the Middle East and Ukraine, and supply worries following Ukrainian drone attacks on Russian oil refineries. Additionally, gold prices reached a historic peak in March, closing at US$2,229.87 per ounce. Gold has proven to be one of the standout performers among major commodities year-to-date, with an 8% increase in the first quarter.
The dollar index demonstrated resilience, advancing by 0.3% throughout the month, despite indications of a Federal Reserve rate cut in June and the record-breaking surge in gold prices. Market analysts anticipate continued strength in the U.S. dollar, propelled by robust economic data from the United States.
Outlook
The U.S. economy has proven resilient, with U.S. job openings remaining high at 8.756 million in February 2024, above market expectations of 8.75 million. Inflation rose in line with expectations in February, with the personal consumption expenditures price index excluding food and energy increasing by 2.8% on an annual basis and up 0.3% from the previous month. The combination of stickier-than-expected inflation with an economy that’s still growing has likely kept the Federal Reserve on hold before it can start considering interest rate cuts. At its last meeting on March 20, the Federal Reserve increased its forecasts for real GDP growth and inflation. The projected change in real GDP for 2024 is now revised higher to 2.1% in the March projection, up from 1.4% in December. Core PCE inflation projections also ticked up, to 2.6% from 2.4%.
China, the world’s second-largest economy, began the year with promising signs of improvement, providing some relief for policymakers amidst ongoing challenges in the property sector. March witnessed an improvement in China’s official Manufacturing Purchasing Managers’ Index (PMI), reaching a one-year peak of 50.8, up from February’s 49.1. Additionally, the Caixin/S&P Global manufacturing PMI rose to 51.1 in March, surpassing the previous month’s 50.9. Meanwhile, factory output and retail sales in the January-February period also exceeded market expectations. The People’s Bank of China (PBOC) maintained its benchmark lending rates unchanged after slashing the Reserve Requirement Ratio (RRR) by 50 basis points in January. At the annual National People’s Congress in March, the Chinese government unveiled a 2024 economic growth target of “around 5%,” underscoring its commitment to sustainable development.
Table 1: KDI Invest Portfolio Performance As at 31 March 2024

The provided table offers information on the cumulative performance of selected KDI portfolios since their launch on February 15, 2022. The portfolio returns (in USD) range from -4.0% to -0.2%. Year-to date, all portfolios recorded returns within a range of 2.2% to 6.2%.
Equities have been propelled to new highs mainly because of the “Magnificent Seven’s” contribution to market rallies amid AI optimism. The S&P500 index has surged over 25% since October due to AI optimism and expectations of the Fed signalling three rate cuts in 2024. However, there’s a looming concern that this bullish sentiment might wane, potentially leading to a market downturn from the current peak levels, especially if inflation persists or resurges, prompting the Federal Reserve to sustain elevated interest rates longer than anticipated by the market. Concurrently, China’s economic recovery is progressing slower than forecasted, which could constrain global economic expansion and bolster gold’s status as a safe-haven asset during market uncertainty.
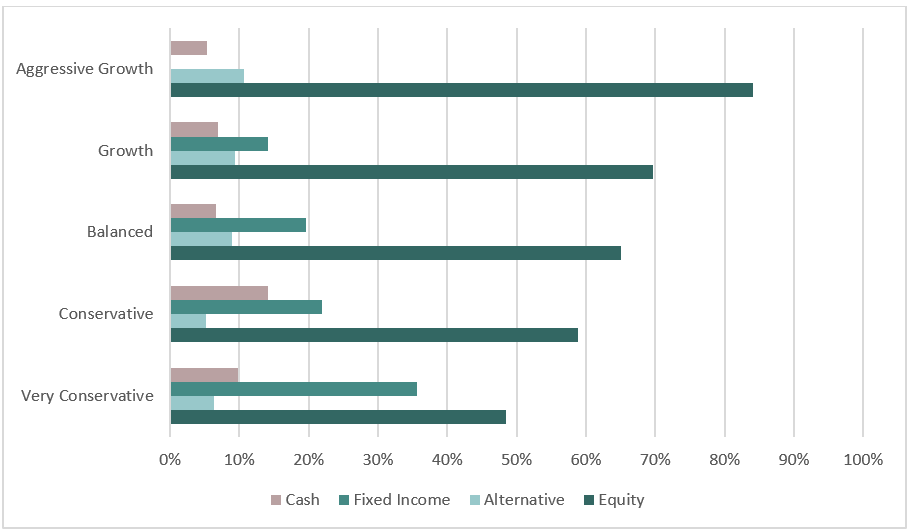
The KDI portfolios maintain diversification to navigate through market volatility, with current allocations to equity ranging from 42% to 86%. Fixed income constitutes an allocation of up to 33%, while alternative investments, primarily in the gold ETF (GLD), make up to 11% of the portfolio. Cash holdings range from 4% to 20%.
Chart 2: Asset Class Exposure As at 31 March 2024

Please note that the performance and asset class exposure mentioned above are derived from five proxy portfolios. The actual performance and exposure of KDI Invest portfolio may differ due to the customisation by our A.I. based robo-advisor, which tailors investment to individual risk profiles, as well as the timing of market entry.
Citation:
https://www.cmegroup.com/markets/interest-rates/cme-fedwatch-tool.html
