June 2022 Market Insights

Brought to you by the Kenanga Digital Investing (KDI) team, here is our fifth Market Insights column. Our Head of Digital Investing, Cheong Yew Huan will discuss the latest in financial news and present his thoughts on making the most of today’s market.
Market Recap
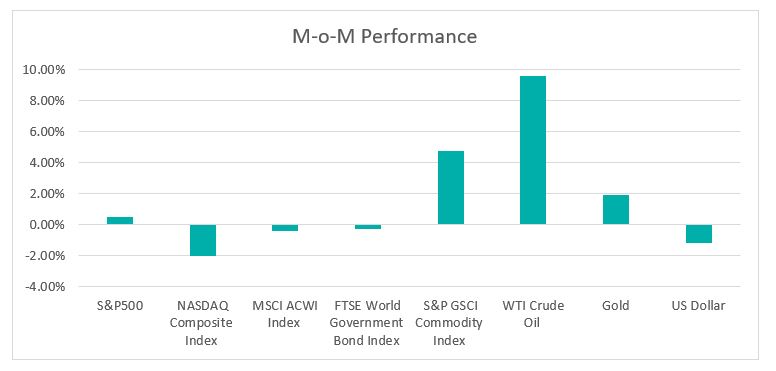
Chart 1: Index Performance in May 2022

The volatility persisted in May with the S&P500 hitting bear market territory with a decline of nearly 21% from its January peak before clawing back and was unchanged on a month-on-month basis. The Nasdaq composite was 2.05% lower during the month as investors generally have been shifting away from growth stocks.
The Federal Reserve increased rates by 50bps in May, in line with market expectations. The Fed also outlined its balance sheet reduction, beginning to wind down US$30 billion of Treasury and US$17.5 billion of mortgage-backed securities per month. The Fed targets to accelerate the wind down to US$95 billion a month by September (US$60 billion Treasury and US$35 billion of mortgage-backed securities). Despite these changes, there was little movement in US Treasury yields during the month. The 10-year Treasury yield moved lower by 16 basis points to 2.84% while the 2-year yield fell by 4 basis points to 2.54%. The bond investor now expects another two sequential 50 bps hikes in June and July.
Oil prices climbed above USD121 per barrel, hitting a two-month high as EU leaders reached an agreement to slash oil imports from Russia. European Union leaders agreed in principle to cut 90% of oil imports from Russia by end of 2022. With Shanghai having announced an end to its two-month-long lockdown, the oil demand may pick up gradually and further supports the oil prices.
The US Dollar Index, which hit a two-decade high of 105.010 earlier in May, slipped lower and posted its first monthly drop in five months on the expectation of the Federal Reserve will tighten at a slower pace after two more half-point rate hikes in the next two months.
Market Outlook
While the US economy is holding up with the current job market and consumer spending remains robust, the recession risk is rising in the light of the ongoing Federal Reserve rate hikes will weigh on mortgage payments and consumer purchasing power. The downside risk remains high given:
a) High inflation is a threat to consumer spending. The inflation accelerated to 8.3% in April, down slightly from 8.5% in March but it remains close to a 40-year high. The CPI’s food index increased by 9.4%, the largest 12- month increase since April 1981, at a level unseen since the 1980s. This indicates that US consumers may struggle to afford necessities including food and general merchandise.
b) Increasing warnings from Corporate Earnings: According to Factset data, sixty-eight S&P500 companies provided negative EPS guidance for 1Q22, the highest number since 4Q2019. The S&P500 reported growth in earnings of 9%, the lowest growth rate since 4Q 2020. Companies are beating consensus EPS estimates by 4.6%, below the five-year average of 8.9%.
c) Liquidity risk as Federal Reserve pares balance sheet. To recap, the Federal Reserve’s balance sheet ballooned to US$9 trillion during the pandemic due to aggressive monthly bond and mortgage-backed securities purchases. The liquidity injection into the financial system has contributed to elevated inflation and stock market rally. The new balance sheet normalisation pace is nearly twice the pace of its last effort in the 2017-2019 cycle, where the maximum pace of USD50 billion a month was targeted. The faster pace of quantitative tightening this round will slash the money supply and create a headwind to the high-risk asset classes including the stock market.
d) Positive economic data provides the Federal Reserve room to hike rates. Any upcoming positive economic data may be bad news for equities as investors might react negatively to the expectation that the Fed will maintain its monetary tightening policy stance. It is widely expected that the Fed will pause its monetary policy tightening only if there is a sign of a slowdown in economic data or if inflation subsides.
KDI Invest Portfolio Performance As of 31 May 2022

Remarks:
Benchmark: Equity: MSCI ACWI Index + Fixed Income: FTSE World Government Bond Index
Past performance is not indicative of future results.
The above table shows the performance of selected KDI portfolios since its launch on 15 February. Our returns ranged from -8.2% to -3.6%. The portfolio performance was relatively flattish in May with The ETF outperformers including iShares MSCI Brazil Capped ETF (EWZ) and iShares iBoxx Investment Grade Corporate Bond (LQD) while iShares MSCI Malaysia ETF was an underperformer during the month.
A new portfolio rebalancing was triggered late May 2022 where the robo-advisor A.I. adopted a defensive move to reduce the portfolio risk further. This was on top of the portfolio rebalancing done at the end of April 2022.
The major changes are as follows:
• The uncertainty in the equity asset class remains high due to increasing risks of slowing global growth and the robo-advisor A.I. has reduced the weighting further.
• Increased weighting in fixed income with largest exposure in iShares Short Treasury Bond ETF (SHV). SHV tracks the investment results of an index composed of US Treasury bonds with remaining maturities of one year or less. Given its duration is short and exposed to minimal interest rate risk as compared to longer-term bonds, SHV is considered a safe and secure instrument for many investors during unpredictable times.
• Increased cash or cash-equivalent holdings exposure. In this uncertain environment, many robo-advisor A.I. tend to favour portfolio flexibility and liquidity to respond to events and potentially take advantage of nascent opportunities.
Please note that the above performance is based on five proxy portfolios. Actual KDI Invest portfolio performance may vary from the above due to the customization by the KDI robo-advisor A.I. based on investors’ risk profiling, as well as the timing of market entry.
Citation:
https://insight.factset.com/earnings-insight-q1-22-by-the-numbers-infographic
